Comprehensive assessment of T-cell receptor beta-chain diversity in alphabeta T cells - PubMed (original) (raw)
Comprehensive assessment of T-cell receptor beta-chain diversity in alphabeta T cells
Harlan S Robins et al. Blood. 2009.
Abstract
The adaptive immune system uses several strategies to generate a repertoire of T- and B-cell antigen receptors with sufficient diversity to recognize the universe of potential pathogens. In alphabeta T cells, which primarily recognize peptide antigens presented by major histocompatibility complex molecules, most of this receptor diversity is contained within the third complementarity-determining region (CDR3) of the T-cell receptor (TCR) alpha and beta chains. Although it has been estimated that the adaptive immune system can generate up to 10(16) distinct alphabeta pairs, direct assessment of TCR CDR3 diversity has not proved amenable to standard capillary electrophoresis-based DNA sequencing. We developed a novel experimental and computational approach to measure TCR CDR3 diversity based on single-molecule DNA sequencing, and used this approach to determine the CDR3 sequence in millions of rearranged TCRbeta genes from T cells of 2 adults. We find that total TCRbeta receptor diversity is at least 4-fold higher than previous estimates, and the diversity in the subset of CD45RO(+) antigen-experienced alphabeta T cells is at least 10-fold higher than previous estimates. These methods should prove valuable for assessment of alphabeta T-cell repertoire diversity after hematopoietic cell transplantation, in states of congenital or acquired immunodeficiency, and during normal aging.
Figures
Figure 1
Strategy for PCR amplification, hybridization, and sequencing of rearranged _TCR_β CDR3 regions. A generic rearranged _TCR_β CDR3 region PCR product is shown, indicating the constituent Vβ segment, Dβ segment, Jβ segment, and the nontemplated nucleotides inserted at the Vβ-Dβ and Dβ-Jβ junctions. Universal adapter sequences that permit solid-phase PCR on the Illumina Genome Analyzer Cluster Station (GA F and GA R) are incorporated into the 5′ and 3′ ends of the PCR products that capture each rearranged _TCR_β CDR3 region. Forty-five forward primers were designed, each specific to a single functional Vβ segment or a small family of Vβ segments. The 3′ end of each Vβ forward primer is anchored at position −43 in the Vβ segment, relative to the recombination signal sequence, thereby providing a unique Vβ tag sequence within the amplified region. Vβ forward primers were designed for all known nonpseudogenes in the _TCR_β locus. The 13 reverse primers specific to each Jβ segment are anchored in the 3′ intron, with the 3′ end of each primer crossing the intron/exon junction. The Jβ reverse primers were designed to be anchored at their 3′ ends on a consensus splice site motif to minimize overlap with the sequencing primers. Thirteen sequencing primers were designed that are complementary to the amplified portion of the Jβ segment, such that the first few bases of sequence generated will capture the unique Jβ tag sequence. The sequencing primers were designed so that promiscuous priming of a sequencing reaction for one J segment by a primer specific to another J segment would generate sequence data starting at exactly the same nucleotide as sequence data from the correct sequencing primer.
Figure 2
Observed _TCR_β CDR3 sequence copy number per 5 mL whole blood. Frequency histograms of _TCR_β CDR3 sequences observed in 4 different T-cell subsets distinguished by expression of CD4, CD8, and CD45RO and present in 5 mL blood of one male donor. For example, the square at 200,10 means that 10 unique sequences were each observed 200 times in the CD4+CD45RO+ (antigen-experienced) T-cell sample. The data were resampled from the sequences generated by the Genome Analyzer to approximate the expected CDR3 sequence distribution in the T cells present in 5 mL blood, as determined by flow cytometry. A small set of sequences found in the CD45RO+ compartments were found with very large copy number (> 10 000 copies) but are not displayed.
Figure 3
Assessment of PCR bias. The rearranged _TCR_β CDR3 regions present in approximately 30 000 T-cell genomes were amplified through 25 cycles of PCR, and the PCR products were split into 2 pools. One pool was amplified an additional 15 cycles, and then the PCR products from the 25-cycle and 40-cycle reactions were sequenced in separate lanes of a GA1 flow cell. Of the _TCR_β CDR3 sequences observed in the 25-cycle PCR lane, 97% were also observed in the 40-cycle PCR lane. Each point on the graph represents a single unique CDR3 sequence, plotted according to the number of times that sequence was observed in the data from 25-cycle (abscissa) and 40-cycle (ordinate) PCR reactions, respectively. The density of sequences at each point in the plot is indicated by color, with purple the highest density and red the lowest. The solid line represents a linear regression of the data, and the dotted lines 1 SD above and below the mean.
Figure 4
Jβgene segment use in 4 different T-cell compartments. Jβ gene segment use of _TCR_β CDR3 sequences observed in the 4 different flow cytometrically defined T-cell compartments from donor 1.
Figure 5
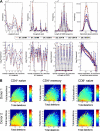
Relative abundance of unique _TCR_β CDR3 sequences correlates inversely with divergence from germline. (A) Observed frequency (top panels) and average observed frequency (bottom panels) of _TCR_β CDR3 sequences in the CD8+CD45RO+/− and CD4+CD45RO+/− T-cell compartments of 2 male donors plotted, from left to right, according to their Jβ and Vβ gene segment use, CDR3 length, and total number of (inserted + deleted) nucleotides at the Vβ-Dβ and Dβ-Jβ junctions. (B) Heat map representation of relative abundance of TCRβ CDR3 sequences observed in CD4+ naive, CD4+ memory, and CD8+ naive T-cell compartments of the 2 male donors arrayed according to the number of nucleotides deleted or inserted at the Vβ-Dβ and Dβ-Jβ junctions. Color indicates the log10(observed frequency) of the sequences with the indicated number of inserted or deleted junctional nucleotides.
Figure 6
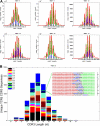
Direct _TCR_β CDR3 sequencing captures all of the TCR diversity information present in a conventional spectratype. (A) Comparison of standard TCRβ spectratype data and calculated _TCR_β CDR3 length distributions for sequences using representative TCR Vβ gene segments and present in CD4+CD45RO+ cells from male donor 1. CDR3 length is plotted along the x-axis and the number of unique CDR3 sequences with that length (GA sequence data) or the relative intensity of the corresponding peak in the spectratype is plotted along the y-axis. Reducing the information contained in the GA sequence data to a frequency histogram of the unique CDR3 sequences with different lengths within each Vβ family readily reproduces all of the information contained in the spectratype data. The length of the differently colored segments within each bar of the histograms indicates the fraction of unique CDR3 sequences that were observed 1 to 5 times (black), 6 to 10 times (blue), 11 to 100 times (green), or more than 100 times (red). (B) A representative “virtual spectratype” of TCRβ CDR3 sequences extracted from CD4+CD45RO+ T cells from donor 1 that use the Vβ10 gene segment. The CDR3 sequences using Vβ10 were sorted by CDR3 length into a frequency histogram, and the sequences within each length bin were then color-coded on the basis of their Jβ use. The inset shows all of the CDR3 sequences using Vβ10 and Jβ2-6, and having a length of 39 nt, as well as the number of times that each of these sequences was observed in the data. The origin of the nucleotides in each sequence is color-coded as follows: Vβ gene segment, red; template-independent N nucleotide, black; Dβ gene segment, blue; Jβ gene segment, green.
Similar articles
- T-Cell receptor Vbeta repertoire CDR3 length diversity differs within CD45RA and CD45RO T-cell subsets in healthy and human immunodeficiency virus-infected children.
Kou ZC, Puhr JS, Rojas M, McCormack WT, Goodenow MM, Sleasman JW. Kou ZC, et al. Clin Diagn Lab Immunol. 2000 Nov;7(6):953-9. doi: 10.1128/CDLI.7.6.953-959.2000. Clin Diagn Lab Immunol. 2000. PMID: 11063505 Free PMC article. - T cell receptor CDR3 loop length repertoire is determined primarily by features of the V(D)J recombination reaction.
Hughes MM, Yassai M, Sedy JR, Wehrly TD, Huang CY, Kanagawa O, Gorski J, Sleckman BP. Hughes MM, et al. Eur J Immunol. 2003 Jun;33(6):1568-75. doi: 10.1002/eji.200323961. Eur J Immunol. 2003. PMID: 12778474 - Annotation of pseudogenic gene segments by massively parallel sequencing of rearranged lymphocyte receptor loci.
Dean J, Emerson RO, Vignali M, Sherwood AM, Rieder MJ, Carlson CS, Robins HS. Dean J, et al. Genome Med. 2015 Nov 23;7:123. doi: 10.1186/s13073-015-0238-z. Genome Med. 2015. PMID: 26596423 Free PMC article. - Application of the molecular analysis of the T-cell receptor repertoire in the study of immune-mediated hematologic diseases.
Plasilova M, Risitano A, Maciejewski JP. Plasilova M, et al. Hematology. 2003 Jun;8(3):173-81. doi: 10.1080/1024533031000107505. Hematology. 2003. PMID: 12745651 Review. - Antigen recognition by gammadelta T cells.
Chien YH, Konigshofer Y. Chien YH, et al. Immunol Rev. 2007 Feb;215:46-58. doi: 10.1111/j.1600-065X.2006.00470.x. Immunol Rev. 2007. PMID: 17291278 Review.
Cited by
- Immunotherapy response induces divergent tertiary lymphoid structure morphologies in hepatocellular carcinoma.
Shu DH, Ho WJ, Kagohara LT, Girgis A, Shin SM, Danilova L, Lee JW, Sidiropoulos DN, Mitchell S, Munjal K, Howe K, Bendinelli KJ, Kartalia E, Qi H, Mo G, Montagne J, Leatherman JM, Lopez-Vidal TY, Zhu Q, Huff AL, Yuan X, Hernandez A, Coyne EM, Zaidi N, Zabransky DJ, Engle LL, Ogurtsova A, Baretti M, Laheru D, Durham JN, Wang H, Sunshine JC, Johnston RJ, Deutsch JS, Taube JM, Anders RA, Jaffee EM, Fertig EJ, Yarchoan M. Shu DH, et al. Nat Immunol. 2024 Nov;25(11):2110-2123. doi: 10.1038/s41590-024-01992-w. Epub 2024 Oct 25. Nat Immunol. 2024. PMID: 39455893 - Comparison of B Cell Variable Region Gene Segment Characteristics in Neuro-autoantibodies.
Abd El Baky H, Weinstock NI, Khan Sial GZ, Hicar MD. Abd El Baky H, et al. Immunohorizons. 2024 Oct 1;8(10):740-748. doi: 10.4049/immunohorizons.2400037. Immunohorizons. 2024. PMID: 39446034 Free PMC article. Review. - Intratumoral STING agonist reverses immune evasion in PD-(L)1-refractory Merkel cell carcinoma: mechanistic insights from detailed biomarker analyses.
Pulliam T, Jani S, Goff PH, Bhakuni R, Tabachnick-Cherny S, Smythe K, Seaton BW, Tachiki L, Kulikauskas R, Church C, Koelle DM, Nghiem P, Bhatia S. Pulliam T, et al. J Immunother Cancer. 2024 Oct 14;12(10):e009803. doi: 10.1136/jitc-2024-009803. J Immunother Cancer. 2024. PMID: 39401968 Free PMC article. - Insights into cytomegalovirus-associated T cell receptors in recipients following allogeneic hematopoietic stem cell transplantation.
Xia J, Xiao Y, Gui G, Gong S, Wang H, Li X, Yan R, Fan J. Xia J, et al. Virol J. 2024 Sep 30;21(1):236. doi: 10.1186/s12985-024-02511-x. Virol J. 2024. PMID: 39350155 Free PMC article. - TIRTL-seq: Deep, quantitative, and affordable paired TCR repertoire sequencing.
Pogorelyy MV, Kirk AM, Adhikari S, Minervina AA, Sundararaman B, Vegesana K, Brice DC, Scott ZB; SJTRC Study Team; Thomas PG. Pogorelyy MV, et al. bioRxiv [Preprint]. 2024 Oct 31:2024.09.16.613345. doi: 10.1101/2024.09.16.613345. bioRxiv. 2024. PMID: 39345544 Free PMC article. Preprint.
References
- Rudolph MG, Stanfield RL, Wilson IA. How TCRs bind MHCs, peptides, and coreceptors. Annu Rev Immunol. 2006;24:419–466. - PubMed
- Arstila TP, Casrouge A, Baron V, Even J, Kanellopoulos J, Kourilsky P. A direct estimate of the human alphabeta T cell receptor diversity. Science. 1999;286(5441):958–961. - PubMed
- Shendure J, Ji H. Next-generation DNA sequencing. Nat Biotechnol. 2008;26(10):1135–1145. - PubMed
- Fisher RA, Corbet AS, Williams CB. The relation between the number of species and the number of individuals in a random sample of an animal population. J Anim Ecol. 1943;12:42–58.
- Efron B, Thisted R. Estimating the number of unseen species: How many words did Shakespeare know? Biometrika. 1976;63(3):435–447.
Publication types
MeSH terms
Substances
Grants and funding
- CA015704/CA/NCI NIH HHS/United States
- CA18029/CA/NCI NIH HHS/United States
- DK056465/DK/NIDDK NIH HHS/United States
- P30 DK056465/DK/NIDDK NIH HHS/United States
- R01 CA106512/CA/NCI NIH HHS/United States
- CA106512/CA/NCI NIH HHS/United States
- P01 CA018029/CA/NCI NIH HHS/United States
- P30 CA015704/CA/NCI NIH HHS/United States
LinkOut - more resources
Full Text Sources
Other Literature Sources


