Structure of an arrestin2-clathrin complex reveals a novel clathrin binding domain that modulates receptor trafficking - PubMed (original) (raw)
Structure of an arrestin2-clathrin complex reveals a novel clathrin binding domain that modulates receptor trafficking
Dong Soo Kang et al. J Biol Chem. 2009.
Abstract
Non-visual arrestins play a pivotal role as adaptor proteins in regulating the signaling and trafficking of multiple classes of receptors. Although arrestin interaction with clathrin, AP-2, and phosphoinositides contributes to receptor trafficking, little is known about the configuration and dynamics of these interactions. Here, we identify a novel interface between arrestin2 and clathrin through x-ray diffraction analysis. The intrinsically disordered clathrin binding box of arrestin2 interacts with a groove between blades 1 and 2 in the clathrin beta-propeller domain, whereas an 8-amino acid splice loop found solely in the long isoform of arrestin2 (arrestin2L) interacts with a binding pocket formed by blades 4 and 5 in clathrin. The apposition of the two binding sites in arrestin2L suggests that they are exclusive and may function in higher order macromolecular structures. Biochemical analysis demonstrates direct binding of clathrin to the splice loop in arrestin2L, whereas functional analysis reveals that both binding domains contribute to the receptor-dependent redistribution of arrestin2L to clathrin-coated pits. Mutagenesis studies reveal that the clathrin binding motif in the splice loop is (L/I)(2)GXL. Taken together, these data provide a framework for understanding the dynamic interactions between arrestin2 and clathrin and reveal an essential role for this interaction in arrestin-mediated endocytosis.
Figures
FIGURE 1.
Sequence alignment of arrestins and analysis of arrestin2 expression. A, sequence alignment of bovine visual arrestins (arrestin1 and -4) and non-visual arrestins (arrestin2L, -2S, and -3) was performed by ClustalW (EMBL-EBI). The LϕXϕ(D/E) motif, splice loop, and AP-2 binding site are boxed, and at the bottom of the alignment, identical residues are noted with an asterisk, and conserved residues are noted with a +. B, purified arrestin2L and arrestin2S were electrophoresed along with lysates from RAW 264.7 (0.5 μg), HEK293 (30 μg), and MDA-MB 231 (30 μg) cells on an 8% polyacrylamide gel using a large format vertical gel (Bio-Rad). Proteins were transferred to nitrocellulose paper and detected using an arrestin peptide polyclonal antibody (58). IB, immunoblot.
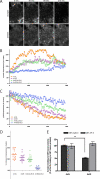
FIGURE 2.
Recruitment of various arrestins to clathrin-coated pits upon GPCR activation. A, montage of FLAG-β2AR and arrestin2S-GFP localization by TIRF microscopy from 0 to 270 s after agonist treatment. B, fluorescence traces from example cells showing the rate of enrichment of the indicated versions of arrestin2-GFP in clusters. The maximum arrestin fluorescence, normalized to the fluorescence before agonist addition, is plotted over time. C, the rate of depletion of surface receptor fluorescence in the same cells, normalized to the surface fluorescence before agonist addition, is shown. β_2-AR_, β2AR. D, the average increase of arrestin2-GFP fluorescence in clusters was calculated per cell (n > 16 cells in each case) and is shown with the mean value. E, binding of purified wild type arrestin2L (Arr2L) and arrestin2S (Arr2S) to GST-clathrin-(1–363) and GST-β2-adaptin-(700–937) was detected and quantified using the Odyssey system. The bars represent the mean ± S.E. from n independent experiments: GST-clathrin (50) and GST-β2-adaptin (13) with Arr2L and Arr2S.
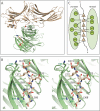
FIGURE 3.
Structure of an arrestin2S-(1–385) complex with clathrin-(1–363). A, ribbon model of the complex shows a molecule of arrestin2S-(1–385) (wheat) bound to a molecule of clathrin-(1–363) (green) using the LϕXϕ(D/E) motif (red). Unstructured areas of the C-terminal loop are depicted as dotted lines, and each end-point of the area is marked with colored spheres. The red spheres connect the C terminus of residue 349 to residue 366 (∼27 Å), and the blue spheres connect residues 372 and 378 (∼14 Å). Although it is possible that the clathrin binding box originates from one arrestin and extends to an adjacent crystallographic arrestin (as there is no clear electron density for residues 350–365), the distance between the termini of the arrestin core and the clathrin binding box suggests that the loop originates and returns from the same arrestin core. B, stereoview of the interface between arrestin2S-(1–385) and clathrin. Residues of the LϕXϕ(D/E) motif and some of the key residues in the hydrophobic pocket of clathrin are numbered as black and green, respectively. C, B is depicted as a one-dimensional map with possible hydrogen bonding (dotted lines) and hydrophobic interactions (bold dotted lines).
FIGURE 4.
Structure of an arrestin2L-(1–393) complex with clathrin-(1–363). A, ribbon model of the complex shows a molecule of clathrin-(1–363) (green) with two molecules of arrestin2L-(1–393) (cyan) using two independent binding interfaces. The boxed area (red) is an additional interface using the splice loop of arrestin2L. B, multiwavelength anomalous diffraction electron density maps (σ = 1.5) showing the splice loop of arrestin2L (top) and detailed structure of the boxed area from A with labeled key residues of arrestin2L and clathrin (bottom; black and green, respectively). C, B is depicted as a one-dimensional map noting possible hydrogen bonding (dotted lines) and hydrophobic interactions (bold dotted lines).
FIGURE 5.
Binding of arrestin2 to wild type and mutated GST-clathrin-(1–363). A, binding of purified wild type arrestin2L (Arr2L), arrestin2S (Arr2S), arrestin2L-ΔLIELD (Arr2L_Δ_LIELD), and arrestin2S-ΔLIELD (Arr2S_Δ_LIELD) to GST-clathrin-(1–363) was detected and quantified using the Odyssey system. The bars represent the mean ± S.E. from n independent experiments: arrestin2L (53), arrestin2S (71), arrestin2L-ΔLIELD (67), and arrestin2S-ΔLIELD (40). Statistical analysis was performed using an unpaired t test (**, p < 0.001) using Prism. TD, terminal domain. B, binding of purified wild type arrestin2L to wild type or mutated (W164H, W164E, and R188A) GST-clathrin-(1–363) was performed as described under “Experimental Procedures.” The bars represent the mean ± S.E. from 14 independent experiments. Statistical analysis was performed using an unpaired t test (*, p < 0.005; **, p < 0.001) using Prism. C, binding of purified arrestin2L-ΔLIELD and arrestin2S-ΔLIELD to wild type (gray bar, data are from Fig. 5_A_) or W164E mutant GST-clathrin-(1–363) (white bar). Note the difference in the y axis scale in A and C. D, specific binding of clathrin heavy chain (CHC) to arrestin2L (Arr2L) and 2S (Arr2S) at steady-state level (Req) was measured by BIAevaluation 3.0 and analyzed as a Scatchard plot (inset). Kd values for arrestin2L (0.98 ± 0.01 μ
m
) and arrestin 2S (2.1 ± 0.4 μ
m
) were determined using a steady-state affinity model from 3 independent experiments.
FIGURE 6.
Binding of clathrin terminal domain to wild type and mutated GST-arrestin2L-(319–418)-ΔLIELD. A, binding of purified clathrin-(1–363) to wild type or mutated GST-arrestin2L-(319–418)-ΔLIELD was detected and quantified using the Odyssey system. The bars represent the mean ± S.E. from n independent experiments: WT (52), L334/5A (22), L334A (32), L335A (40), G336A (16), D337A (19), L338A (24), S340/1A (15), and Δloop (19). B, binding of purified clathrin-(1–363) to wild type or mutated GST-arrestin2L-(319–418)-ΔLIELD was detected and quantified as in panel A. The bars represent the mean ± S.E. from n independent experiments: WT (20), L334I (9), L334V (6), and L334F (8). C, binding of purified clathrin-(1–363) to wild type or mutated GST-arrestin2L-(319–418)-ΔLIELD was detected and quantified as in panel A. The bars represent the mean ± S.E. from n independent experiments: WT (20), L335I (12), L335V (8), and L335F (8). D, binding of purified clathrin-(1–363) to wild type or mutated GST-arrestin2L-(319–418)-ΔLIELD was detected and quantified as in panel A. The bars represent the mean ± S.E. from n independent experiments: WT (37), L338I (24), L338V (9), and L338F (26).
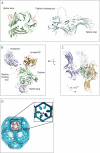
FIGURE 7.
Comparison of arrestin position in clathrin superposition. A, top view of the clathrin terminal domain shows two distinct interactions with arrestin2L, which are depicted as red ribbons (left). The side view of arrestin2L shows two separated clathrin binding sites, the LϕXϕ(D/E) motif and splice loop (right, red dotted lines). B, side view; arrestins (cyan, low resolution; wheat, high resolution) near the clathrin binding box (red ribbon) do not superimpose upon the superposition of clathrin (green) from the different crystal forms. Also shown is the second arrestin with a splice loop. Each end point of flanking regions in unstructured C-terminal loop is marked and connected as blue balls and a dotted line for the N-terminal area and red balls and a dotted line for the C-terminal area. C, top view; same as B but rotated 90° in a plane and looking down at approximate rotation axis relating the two arrestins. D, electron microscopy image of a clathrin barrel with a set of clathrin terminal domains shown in red (from Edeling et al. (59)). The enlarged inset is a schematic representation of the six terminal domains within the cluster, depicting a distance of ∼64 Å between terminal domains. The distance between terminal domains was measured using the measurement function in PyMol using PDB code 1XI4 for the clathrin D6 coat (48).
Similar articles
- Arrestin2/clathrin interaction is regulated by key N- and C-terminal regions in arrestin2.
Kern RC, Kang DS, Benovic JL. Kern RC, et al. Biochemistry. 2009 Aug 4;48(30):7190-200. doi: 10.1021/bi900369c. Biochemistry. 2009. PMID: 19555118 Free PMC article. - Arrestin/clathrin interaction. Localization of the arrestin binding locus to the clathrin terminal domain.
Goodman OB Jr, Krupnick JG, Gurevich VV, Benovic JL, Keen JH. Goodman OB Jr, et al. J Biol Chem. 1997 Jun 6;272(23):15017-22. doi: 10.1074/jbc.272.23.15017. J Biol Chem. 1997. PMID: 9169477 - Differential roles of arrestin-2 interaction with clathrin and adaptor protein 2 in G protein-coupled receptor trafficking.
Kim YM, Benovic JL. Kim YM, et al. J Biol Chem. 2002 Aug 23;277(34):30760-8. doi: 10.1074/jbc.M204528200. Epub 2002 Jun 17. J Biol Chem. 2002. PMID: 12070169 - The interaction of beta-arrestin with the AP-2 adaptor is required for the clustering of beta 2-adrenergic receptor into clathrin-coated pits.
Laporte SA, Oakley RH, Holt JA, Barak LS, Caron MG. Laporte SA, et al. J Biol Chem. 2000 Jul 28;275(30):23120-6. doi: 10.1074/jbc.M002581200. J Biol Chem. 2000. PMID: 10770944 - Getting in touch with the clathrin terminal domain.
Lemmon SK, Traub LM. Lemmon SK, et al. Traffic. 2012 Apr;13(4):511-9. doi: 10.1111/j.1600-0854.2011.01321.x. Epub 2012 Jan 13. Traffic. 2012. PMID: 22239657 Free PMC article. Review.
Cited by
- The multifaceted functions of β-arrestins and their therapeutic potential in neurodegenerative diseases.
Kee TR, Khan SA, Neidhart MB, Masters BM, Zhao VK, Kim YK, McGill Percy KC, Woo JA. Kee TR, et al. Exp Mol Med. 2024 Feb;56(1):129-141. doi: 10.1038/s12276-023-01144-4. Epub 2024 Jan 11. Exp Mol Med. 2024. PMID: 38212557 Free PMC article. Review. - Discrete GPCR-triggered endocytic modes enable β-arrestins to flexibly regulate cell signaling.
Barsi-Rhyne B, Manglik A, von Zastrow M. Barsi-Rhyne B, et al. Elife. 2022 Oct 17;11:e81563. doi: 10.7554/eLife.81563. Elife. 2022. PMID: 36250629 Free PMC article. - A single mutation in arrestin-2 prevents ERK1/2 activation by reducing c-Raf1 binding.
Coffa S, Breitman M, Spiller BW, Gurevich VV. Coffa S, et al. Biochemistry. 2011 Aug 16;50(32):6951-8. doi: 10.1021/bi200745k. Epub 2011 Jul 13. Biochemistry. 2011. PMID: 21732673 Free PMC article. - Structural studies of phosphorylation-dependent interactions between the V2R receptor and arrestin-2.
He QT, Xiao P, Huang SM, Jia YL, Zhu ZL, Lin JY, Yang F, Tao XN, Zhao RJ, Gao FY, Niu XG, Xiao KH, Wang J, Jin C, Sun JP, Yu X. He QT, et al. Nat Commun. 2021 Apr 22;12(1):2396. doi: 10.1038/s41467-021-22731-x. Nat Commun. 2021. PMID: 33888704 Free PMC article. - GPCR-dependent and -independent arrestin signaling.
Gurevich VV, Gurevich EV. Gurevich VV, et al. Trends Pharmacol Sci. 2024 Jul;45(7):639-650. doi: 10.1016/j.tips.2024.05.007. Epub 2024 Jun 20. Trends Pharmacol Sci. 2024. PMID: 38906769 Free PMC article. Review.
References
- Dohlman H. G., Thorner J., Caron M. G., Lefkowitz R. J. (1991) Annu. Rev. Biochem. 60, 653–688 - PubMed
- Marinissen M. J., Gutkind J. S. (2001) Trends Pharmacol. Sci. 22, 368–376 - PubMed
- Ferguson S. S. (2001) Pharmacol. Rev. 53, 1–24 - PubMed
- Moore C. A., Milano S. K., Benovic J. L. (2007) Annu. Rev. Physiol. 69, 451–482 - PubMed
- Krupnick J. G., Benovic J. L. (1998) Annu. Rev. Pharmacol. Toxicol. 38, 289–319 - PubMed
Publication types
MeSH terms
Substances
Grants and funding
- R37 DA010711/DA/NIDA NIH HHS/United States
- GM068857/GM/NIGMS NIH HHS/United States
- R29 DA010711/DA/NIDA NIH HHS/United States
- R01 GM068857/GM/NIGMS NIH HHS/United States
- DA010711/DA/NIDA NIH HHS/United States
- GM047417/GM/NIGMS NIH HHS/United States
- R01 GM047417/GM/NIGMS NIH HHS/United States
- R37 GM047417/GM/NIGMS NIH HHS/United States
- R01 DA010711/DA/NIDA NIH HHS/United States
LinkOut - more resources
Full Text Sources
Molecular Biology Databases
Research Materials


