The Ca2+ channel subunit beta2 regulates Ca2+ channel abundance and function in inner hair cells and is required for hearing - PubMed (original) (raw)
The Ca2+ channel subunit beta2 regulates Ca2+ channel abundance and function in inner hair cells and is required for hearing
Jakob Neef et al. J Neurosci. 2009.
Abstract
Hearing relies on Ca(2+) influx-triggered exocytosis in cochlear inner hair cells (IHCs). Here we studied the role of the Ca(2+) channel subunit Ca(V)beta(2) in hearing. Of the Ca(V)beta(1-4) mRNAs, IHCs predominantly contained Ca(V)beta(2). Hearing was severely impaired in mice lacking Ca(V)beta(2) in extracardiac tissues (Ca(V)beta(2)(-/-)). This involved deficits in cochlear amplification and sound encoding. Otoacoustic emissions were reduced or absent in Ca(V)beta(2)(-/-) mice, which showed strongly elevated auditory thresholds in single neuron recordings and auditory brainstem response measurements. Ca(V)beta(2)(-/-) IHCs showed greatly reduced exocytosis (by 68%). This was mostly attributable to a decreased number of membrane-standing Ca(V)1.3 channels. Confocal Ca(2+) imaging revealed presynaptic Ca(2+) microdomains albeit with much lower amplitudes, indicating synaptic clustering of fewer Ca(V)1.3 channels. The coupling of the remaining Ca(2+) influx to IHC exocytosis appeared unaffected. Extracellular recordings of sound-evoked spiking in the cochlear nucleus and auditory nerve revealed reduced spike rates in the Ca(V)beta(2)(-/-) mice. Still, sizable onset and adapted spike rates were found during suprathreshold stimulation in Ca(V)beta(2)(-/-) mice. This indicated that residual synaptic sound encoding occurred, although the number of presynaptic Ca(V)1.3 channels and exocytosis were reduced to one-third. The normal developmental upregulation, clustering, and gating of large-conductance Ca(2+) activated potassium channels in IHCs were impaired in the absence of Ca(V)beta(2). Moreover, we found the developmental efferent innervation to persist in Ca(V)beta(2)-deficient IHCs. In summary, Ca(V)beta(2) has an essential role in regulating the abundance and properties of Ca(V)1.3 channels in IHCs and, thereby, is critical for IHC development and synaptic encoding of sound.
Figures
Figure 1.
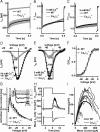
Reduced Ca2+ influx in _CaV_β_2_−/− IHCs. A, Average calcium current (_I_Ca ± SEM) of WT (black ± light gray; n = 11) and _CaV_β_2_−/− (gray ± light gray; n = 7) IHCs in response to 500 ms depolarization to −14 mV in 5 m
m
extracellular Ca2+. B, Average _I_Ca as in A but normalized to peak current. Note that calcium current inactivation is enhanced in _CaV_β_2_−/− cells but lacks a fast component. C, Average currents (normalized to peak) in 5 m
m
[Ba2+]e for WT (n = 11) and _CaV_β_2_−/− (n = 7) IHCs. D, Current–voltage (I–V) relationship for WT (black; n = 8) and _CaV_β_2_−/− (gray; n = 8) IHCs in 10 m
m
[Ca2+]e. Calcium currents were measured 8 ms after the onset of a depolarization to −14 mV. E, I–V relationship, measured as in D, with 5 m
m
[Ba2+]e replacing calcium. F, Activation curves for Ba2+ currents. G/_G_max curves were calculated with G = I/(V − _V_reversal) and were fitted individually with a Boltzmann function. The Ba2+ reversal potential was linearly extrapolated from the 0–20 mV range in E. G, Activation time constants of Ca2+ currents (same as in D) at various membrane voltages were approximated by fitting a power exponential equation,
, to the first 5 ms of the current. The inset shows examples of the first 10 ms after depolarization to the potential indicated. The power exponential fits are indicated by dashed lines. The time frame used for building the steady-state I–V in D is indicated by the gray bar. H, Voltage-clamp protocol (top), variance (middle), and mean calcium current (bottom) calculated from a p/n corrected ensemble of 520 sweeps used to determine the variance–mean plots in I. I, Calcium current variance versus mean for eight WT (black) and six _CaV_β_2_−/− (gray) IHCs. Bold lines represent the overall average.
Figure 2.
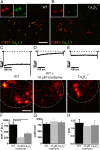
Clustering of fewer Ca2+ channels at the synapses of _CaV_β_2_−/− IHCs. A, B, Representative projections of confocal sections from WT (A) and _CaV_β_2_−/− (B) IHCs immunolabeled for ribbons (anti-CtBP2) and the CaV1.3 channels (anti-α1D). In WT, there is clear overlap (yellow) indicating colocalization of Ca2+ channel clusters and ribbons. Scale bar, 5 μm. Insets show separated color channels in a higher magnification (field of view, 3.27 × 3.27 μm). C–E, Representative Ca2+ current traces in WT IHCs (in response to 390 ms depolarizations to −14 mV) in the absence (C) and presence (D) of 10 μ
m
of the Ca-channel-blocker isradipine and in a _CaV_β_2_−/− IHC (E). Below, background-subtracted confocal scans of the corresponding cells (outlined) filled with the fluorescent calcium indicator Fluo-5N (400 μ
m
) and calcium chelator EGTA (2 m
m
) through a patch pipette are shown during depolarization. Scale bar, 2 μm [identical color scaling in C–E, ranging from 0 (black) to 805 (yellow)]. Hotspots of calcium entry can be recognized in WT and _CaV_β_2_−/− IHCs. F, Average peak fluorescence of Ca2+ microdomains derived from Gaussian fits to line profiles of individual hotspots (background subtracted). The difference between WT (n = 24 Ca2+ microdomains from 6 IHCs) and isradipine-blocked WT (n = 11 Ca2+ microdomains from 4 IHCs) hotspots is significant at p < 0.001, and that between WT and _CaV_β_2_−/− (n = 23 Ca2+ microdomains from 7 IHCs) is significant at p < 0.01. G, Average full-width at half-maximum derived from the same Gaussian fits as in F. H, Average (fast) activation time constants of fluorescence increase derived from high temporal resolution point scans of individual Ca2+ microdomains (n = 17 Ca2+ microdomains from 8 WT IHCs, 2 Ca2+ microdomains from 2 isradipine-treated WT IHCs, and 9 Ca2+ microdomains from 5 _CaV_β_2_−/− IHCs).
Figure 3.
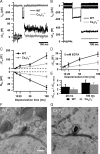
Reduced exocytosis but maintained Ca2+ influx–exocytosis coupling. A, B, Representative Ca2+ currents and membrane capacitance changes (Δ_C_m) elicited by depolarizations to −14 mV for 20 ms (A) and 100 ms (B) in WT (black) and _CaV_β_2_−/− (gray) IHCs. The extracellular solution contained 10 m
m
[Ca2+], and recordings were done in perforated-patch configuration. C, Average Δ_C_m and _Q_Ca for various depolarization (−14 mV) durations in WT (black; n = 7) and _CaV_β_2_−/− (gray; n = 8) IHCs obtained in the perforated-patch configuration. D, Average Δ_C_m for various depolarization durations in WT (black; n = 9) and _CaV_β_2_−/− (gray; n = 7) IHCs in standard whole-cell configuration with 5 m
m
EGTA in the pipette solution. E, Ratio of exocytosis between perforated-patch (Δ_C_m, pp, endogenous buffer) and ruptured-patch (Δ_C_m, EGTA, 5 m
m
EGTA) configuration for WT and _CaV_β_2_−/− IHCs for 20- and 100-ms-long depolarizations. The relative errors (SEM/mean) were propagated from the errors (SEM) of the mean responses in perforated-patch and ruptured-patch (5 m
m
EGTA) experiments. F, G, Electron micrographs of synaptic ribbons in WT (F) and _CaV_β_2_−/− (G) IHCs. Scale bar, 200 nm.
Figure 4.
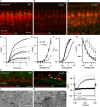
Impaired IHC development in _CaV_β_2_−/− IHCs. A, B, Projection of confocal sections of representative WT (A) and _CaV_β_2_−/− (B) organs of Corti immunostained for BK channels (green) and parvalbumin (red). Tissue was processed identically, and images were acquired under identical conditions. Clusters of BK channels are found at the neck of WT IHCs but not in _CaV_β_2_−/− IHCs. Scale bar, 10 μm. C, Single confocal section from data in B imaged with a higher overall exposure reveals faint BK immunofluorescence along the entire IHC membrane, which was not observed in WT animals. D, The first 3 ms of potassium current in response to 100 ms step depolarizations to the potentials indicated (in millivolts) from a representative WT (black) and _CaV_β_2_−/− (gray) IHC, overlaid with the double-exponential fits to the currents (dashed lines), which revealed the activation time constants shown in G. E, Steady-state I–V relationship of K+ currents for WT (black; n = 20) and _CaV_β_2_−/− (gray; n = 5) IHCs obtained from averaging the current during the last 0.5 ms of 3-ms-long depolarizations. F, Average fractional activation curves acquired from measuring the tail currents between 0.2 and 0.3 ms after the end of a 3 ms depolarizing test pulse (data as in E). Markers represent average data, and continuous lines are the averaged fits to the following equation:
Average values ± SEM for the fit coefficients are as follows: _V_1/2, −22.85 ± 4.27 mV for WT and 10.80 ± 4.04 mV for _CaV_β_2_−/−; slope, 8.7 ± 0.1 mV for WT and 1.5 ± 0.7 mV for _CaV_β_2_−/−. The differences are significant at p < 0.001. G, Average fast activation time constants of the K+ current obtained by fitting a double-exponential function to the first 20 ms of 100 ms depolarization pulses to the potentials indicated. H, I, Immunostainings for SK2 channels (green) and synaptophysin (red) of the basal region of IHC from a WT (G, P21) and a _CaV_β_2_−/− mouse (H, P23). The green background staining arises from pillar cells, which often show unspecific immunoreactivity. Note, however, the presence of SK2-positive spot-like structures in _CaV_β_2_−/− IHCs (arrowheads), which can be seen in most, but not all cells and which are absent from mature WT cells. Scale bar, 5 μm. J, K, Electron micrographs of the basal IHC plasma membrane from WT (J) and _CaV_β_2_−/− (K) mice. The IHC label indicates the cytoplasm of the hair cell. Note the vesicle-filled terminals of efferent fibers making contact with the IHC (J; seen in n = 2 cochleae), which were frequently encountered in _CaV_β_2_−/− mice but rarely in WT animals (K; n = 2 cochleae). Scale bar, 500 nm. L, Apamin-sensitive current in a representative recording from a _CaV_β_2_−/− IHC in response to a 500 ms depolarization pulse to −14 mV (Cs+-based pipette solution, extracellular solution containing 5 m
m
Ca2+): current before (gray) and after (black) addition of 100 n
m
apamin as well as difference current (dotted line). The small inward component in the difference current reflects Ca2+ current rundown during the wash-in of apamin.
Figure 5.
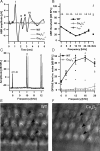
_CaV_β_2_−/− mice are profoundly hearing impaired. A, Grand average of ABRs elicited by suprathreshold click stimuli (100 dB peak equivalent) in WT (black; n = 9) and _CaV_β_2_−/− (light gray; n = 5) mice. For comparison, the ABR from α_1D_−/− mice (dark gray; n = 2) is shown, which lacks a detectable response to 100 dB clicks. B, Hearing thresholds obtained by ABR recordings. The average threshold of _CaV_β_2_−/− (light gray; n = 5 mice) amounts to 90 dB for clicks and exceeds 90 dB (SPL RMS, the highest sound pressure level tested) for 4–32 kHz tone bursts. For comparison, the mean audiograms of WT (black; n = 9) and α_1D_−/− (dark gray; n = 2, no detectable responses to clicks even at 120 dB SPL) mice are shown. C, Representative power spectrum of microphone signal showing primary tones (f1 and f2, 60 dB SPL) and DPOAE at 2f1 − f2 in the WT mouse (black). The trace of the _CaV_β_2_−/− mouse (gray) is laterally offset by 150 Hz for better readability and shows no detectable DPOAE. D, Grand averages of DPOAE levels (relative to the noise floor): sizable DPOAE across all tested frequencies in WT mice (black; n = 4), absent DPOAEs in the lower frequency range, and considerably weaker if present at all in the higher-frequency range in _CaV_β_2_−/− mice (gray; n = 10). The markers represent data points of measurements from individual mice. E, F, Representative contrast enhanced transmission images of the apical organ of Corti of WT (E) and _CaV_β_2_−/− (F) mice. Three rows of intact outer hair cells with V-shaped hair bundles are present in both WT and _CaV_β_2_−/− mice at 4 weeks of age (arrowheads).
Figure 6.
Reduced spike rates in the auditory nerve. A, Representative original recording traces of responses of WT (black) and _CaV_β_2_−/− (gray) mouse auditory nerve fibers to three repetitions of a 50 ms tone burst (depicted below). Mean stimulus intensity for standard PSTHs was 66 dB for WT recordings (30 dB above threshold) and 130 dB for _CaV_β_2_−/− (maximal speaker output). B, Averaged PSTH ± SEM from WT (black; n = 55) and _CaV_β_2_−/− (gray; n = 21) mouse auditory nerve fibers. Inset, Same but applying a stimulus intensity of 10 dB above threshold for all recordings (WT black, n = 26; _CaV_β_2_−/− gray, n = 10). C, Box-and-whisker plot of peak, sustained (average rate at 40–50 ms after stimulus onset) and spontaneous rates of auditory nerve fibers from WT (black, n = 55) and _CaV_β_2_−/− (gray, n = 21) mice. D, Spike rates, averaged over the duration of the stimulus, of individual WT (black; n = 26) and _CaV_β_2_−/− (gray; n = 10) auditory nerve fibers stimulated at varying sound pressure levels.
Similar articles
- Synaptic organization in cochlear inner hair cells deficient for the CaV1.3 (alpha1D) subunit of L-type Ca2+ channels.
Nemzou N RM, Bulankina AV, Khimich D, Giese A, Moser T. Nemzou N RM, et al. Neuroscience. 2006 Sep 15;141(4):1849-60. doi: 10.1016/j.neuroscience.2006.05.057. Epub 2006 Jul 10. Neuroscience. 2006. PMID: 16828974 - Rab3-interacting molecules 2α and 2β promote the abundance of voltage-gated CaV1.3 Ca2+ channels at hair cell active zones.
Jung S, Oshima-Takago T, Chakrabarti R, Wong AB, Jing Z, Yamanbaeva G, Picher MM, Wojcik SM, Göttfert F, Predoehl F, Michel K, Hell SW, Schoch S, Strenzke N, Wichmann C, Moser T. Jung S, et al. Proc Natl Acad Sci U S A. 2015 Jun 16;112(24):E3141-9. doi: 10.1073/pnas.1417207112. Epub 2015 Jun 1. Proc Natl Acad Sci U S A. 2015. PMID: 26034270 Free PMC article. - CaV1.3 channels are essential for development and presynaptic activity of cochlear inner hair cells.
Brandt A, Striessnig J, Moser T. Brandt A, et al. J Neurosci. 2003 Nov 26;23(34):10832-40. doi: 10.1523/JNEUROSCI.23-34-10832.2003. J Neurosci. 2003. PMID: 14645476 Free PMC article. - Ca(v)1.3 and BK channels for timing and regulating cell firing.
Vandael DH, Marcantoni A, Mahapatra S, Caro A, Ruth P, Zuccotti A, Knipper M, Carbone E. Vandael DH, et al. Mol Neurobiol. 2010 Dec;42(3):185-98. doi: 10.1007/s12035-010-8151-3. Epub 2010 Nov 20. Mol Neurobiol. 2010. PMID: 21088933 Review. - How to build an inner hair cell: challenges for regeneration.
Kros CJ. Kros CJ. Hear Res. 2007 May;227(1-2):3-10. doi: 10.1016/j.heares.2006.12.005. Epub 2006 Dec 16. Hear Res. 2007. PMID: 17258412 Review.
Cited by
- New insights into cochlear sound encoding.
Moser T, Vogl C. Moser T, et al. F1000Res. 2016 Aug 26;5:F1000 Faculty Rev-2081. doi: 10.12688/f1000research.8924.1. eCollection 2016. F1000Res. 2016. PMID: 27635230 Free PMC article. Review. - Individual synaptic vesicles mediate stimulated exocytosis from cochlear inner hair cells.
Grabner CP, Moser T. Grabner CP, et al. Proc Natl Acad Sci U S A. 2018 Dec 11;115(50):12811-12816. doi: 10.1073/pnas.1811814115. Epub 2018 Nov 21. Proc Natl Acad Sci U S A. 2018. PMID: 30463957 Free PMC article. - CaBP1 and 2 enable sustained CaV1.3 calcium currents and synaptic transmission in inner hair cells.
Oestreicher D, Chepurwar S, Kusch K, Rankovic V, Jung S, Strenzke N, Pangrsic T. Oestreicher D, et al. Elife. 2024 Dec 24;13:RP93646. doi: 10.7554/eLife.93646. Elife. 2024. PMID: 39718549 Free PMC article. - RBP2 stabilizes slow Cav1.3 Ca2+ channel inactivation properties of cochlear inner hair cells.
Ortner NJ, Pinggera A, Hofer NT, Siller A, Brandt N, Raffeiner A, Vilusic K, Lang I, Blum K, Obermair GJ, Stefan E, Engel J, Striessnig J. Ortner NJ, et al. Pflugers Arch. 2020 Jan;472(1):3-25. doi: 10.1007/s00424-019-02338-4. Epub 2019 Dec 17. Pflugers Arch. 2020. PMID: 31848688 Free PMC article. - Characterization of the transcriptome of nascent hair cells and identification of direct targets of the Atoh1 transcription factor.
Cai T, Jen HI, Kang H, Klisch TJ, Zoghbi HY, Groves AK. Cai T, et al. J Neurosci. 2015 Apr 8;35(14):5870-83. doi: 10.1523/JNEUROSCI.5083-14.2015. J Neurosci. 2015. PMID: 25855195 Free PMC article.
References
- Augustine GJ, Adler EM, Charlton MP. The calcium signal for transmitter secretion from presynaptic nerve terminals. Ann N Y Acad Sci. 1991;635:365–381. - PubMed
- Ball SL, Powers PA, Shin HS, Morgans CW, Peachey NS, Gregg RG. Role of the beta(2) subunit of voltage-dependent calcium channels in the retinal outer plexiform layer. Invest Ophthalmol Vis Sci. 2002;43:1595–1603. - PubMed
- Beutner D, Voets T, Neher E, Moser T. Calcium dependence of exocytosis and endocytosis at the cochlear inner hair cell afferent synapse. Neuron. 2001;29:681–690. - PubMed
- Bichet D, Cornet V, Geib S, Carlier E, Volsen S, Hoshi T, Mori Y, De Waard M. The I–II loop of the Ca2+ channel alpha1 subunit contains an endoplasmic reticulum retention signal antagonized by the beta subunit. Neuron. 2000;25:177–190. - PubMed
Publication types
MeSH terms
Substances
LinkOut - more resources
Full Text Sources
Molecular Biology Databases
Miscellaneous
