The delta-subunit of the epithelial sodium channel (ENaC) enhances channel activity and alters proteolytic ENaC activation - PubMed (original) (raw)
The delta-subunit of the epithelial sodium channel (ENaC) enhances channel activity and alters proteolytic ENaC activation
Silke Haerteis et al. J Biol Chem. 2009.
Abstract
The epithelial sodium channel (ENaC) is probably a heterotrimer with three well characterized subunits (alphabetagamma). In humans an additional delta-subunit (delta-hENaC) exists but little is known about its function. Using the Xenopus laevis oocyte expression system, we compared the functional properties of alphabetagamma- and deltabetagamma-hENaC and investigated whether deltabetagamma-hENaC can be proteolytically activated. The amiloride-sensitive ENaC whole-cell current (DeltaI(ami)) was about 11-fold larger in oocytes expressing deltabetagamma-hENaC than in oocytes expressing alphabetagamma-hENaC. The 2-fold larger single-channel Na(+) conductance of deltabetagamma-hENaC cannot explain this difference. Using a chemiluminescence assay, we demonstrated that an increased channel surface expression is also not the cause. Thus, overall channel activity of deltabetagamma-hENaC must be higher than that of alphabetagamma-hENaC. Experiments exploiting the properties of the known betaS520C mutant ENaC confirmed this conclusion. Moreover, chymotrypsin had a reduced stimulatory effect on deltabetagamma-hENaC whole-cell currents compared with its effect on alphabetagamma-hENaC whole-cell currents (2-fold versus 5-fold). This suggests that the cell surface pool of so-called near-silent channels that can be proteolytically activated is smaller for deltabetagamma-hENaC than for alphabetagamma-hENaC. Proteolytic activation of deltabetagamma-hENaC was associated with the appearance of a delta-hENaC cleavage product at the cell surface. Finally, we demonstrated that a short inhibitory 13-mer peptide corresponding to a region of the extracellular loop of human alpha-ENaC inhibited DeltaI(ami) in oocytes expressing alphabetagamma-hENaC but not in those expressing deltabetagamma-hENaC. We conclude that the delta-subunit of ENaC alters proteolytic channel activation and enhances base-line channel activity.
Figures
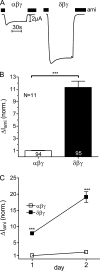
FIGURE 1.
ENaC whole-cell currents are larger in X. laevis oocytes expressing δβγ-hENaC than in those expressing αβγ-hENaC. Oocytes were injected with cRNAs coding for αβγ- or δβγ-hENaC (each 2 ng per subunit). Amiloride-sensitive whole-cell currents (Δ_I_ami) were measured using the two-electrode voltage clamp technique. A, representative whole-cell current traces of an oocyte expressing αβγ-hENaC (left) or δβγ-hENaC (right). Amiloride (ami, 100 μ
m
) was present in the bath solution during the time periods indicated by black bars. B, summary of similar experiments as shown in A performed in αβγ- and δβγ-hENaC-expressing oocytes. To pool data from 11 different batches of oocytes, individual Δ_I_ami values were normalized to the mean Δ_I_ami value of the corresponding αβγ-hENaC-expressing control group. Numbers inside the columns indicate the number of individual oocytes measured. N indicates number of different batches of oocytes. C, Δ_I_ami of αβγ- and δβγ-hENaC-expressing oocytes detected 1 and 2 days after cRNA injection. Each data point represents the mean Δ_I_ami measured in 8–10 individual oocytes of one batch. S.E. values are represented by vertical bars unless they are smaller than the symbols used. ***, p < 0.001, unpaired t test.
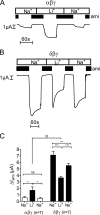
FIGURE 2.
Replacing extracellular Na+ by Li+ increases Δ_I_ami in αβγ-hENaC-expressing oocytes but decreases Δ_I_ami in δβγ-hENaC-expressing oocytes. A and B, representative whole-cell current traces of an oocyte expressing αβγ- (A) or δβγ-hENaC (B) (each 1 ng per subunit). Na+ in the bath solution was temporarily replaced by Li+. Amiloride (ami, 100 μ
m
) was applied as indicated by the black bars. C, mean Δ_I_ami values from seven similar whole-cell current recordings as shown in A and B. n indicates number of individual oocytes measured from one batch. ns is not significant. *, p < 0.05; **, p < 0.01; ***, p < 0.001, paired t test, and §§, p < 0.01, unpaired t test.
FIGURE 3.
Channel surface expression is similar in αβγ- and in δβγ-hENaC-expressing oocytes. Channel surface expression was detected by insertion of a FLAG reporter epitope in the extracellular loop of the β-subunit and a chemiluminescence assay. A and B, relationship between channel surface expression expressed in relative light units (RLU) and Δ_I_ami values measured in parallel in groups of αβγ- (A) and δβγ-hENaC (B)-expressing oocytes injected with different amounts of cRNA (0.1, 0.3, 1, and 3 ng per subunit). Noninjected (ni) oocytes served as negative controls and showed negligible background luminescence. Each square represents the mean of 22–24 oocytes of one batch for surface expression and 7–10 oocytes of the same batch for Δ_I_ami. C, in four different batches of oocytes surface expression and Δ_I_ami values were obtained in parallel in αβγ- and δβγ-hENaC-expressing oocytes. Data were normalized to the corresponding αβγ-hENaC-expressing control group. Oocytes injected with triple amount of cRNA (3 ng per subunit) served as control. Numbers inside the columns indicate the number of individual oocytes measured. N indicates number of different batches of oocytes. **, p < 0.01,***, p < 0.001, unpaired t test.
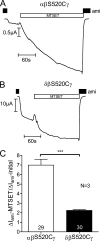
FIGURE 4.
δβγ-hENaC has a higher average _P_o than αβγ-hENaC. Oocytes were injected with cRNAs coding for αβS520Cγ- or δβS520Cγ-hENaC (each 1 ng per subunit). To increase the _P_o of these mutant channels close to 1, the sulfhydryl reagent MTSET (1 m
m
) was added to the bath solution. A and B, representative whole-cell current traces of an oocyte expressing αβS520Cγ-hENaC (A) or δβS520Cγ-hENaC (B). The small artifacts seen in the traces were caused by voltage step protocols. The resulting current responses were omitted from the traces for clarity. C, average ratios of Δ_I_ami measured after MTSET to the initial Δ_I_ami (Δ_I_ami − MTSET/Δ_I_ami − initial). Numbers inside the columns indicate the number of individual oocytes measured. N indicates number of different batches of oocytes. ***, p < 0.001, unpaired t test.
FIGURE 5.
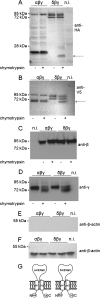
Co-expression of βγ-hENaC enhances proteolytic cleavage of the α-subunit but not of the δ-subunit. Experiments were performed in oocytes injected with cRNAs for δγ-, δ-, or α-hENaC (4 ng per subunit) or with cRNA for αβγ- or δβγ-hENaC (2 ng per subunit). N-terminally HA-tagged and C-terminally V5-tagged α- and δ-hENaC were co-expressed with wild-type β- and γ-hENaC. Western blot analysis of membrane-enriched fractions from oocyte whole-cell lysates was used to study the proteolytic processing of hENaC. Each Western blot represents one of at least five similar blots. Noninjected (n.i.) oocytes demonstrate the absence of a signal in oocytes that do not express ENaC. A and B, α- and δ-hENaC were detected by SDS-PAGE using a 10% gel and an anti-HA antibody (A) or an 8% gel and an anti-V5 antibody (B). The arrows indicate cleavage products. C and D, β- or γ-hENaC was detected by SDS-PAGE (10% gels) using specific antibodies against β- (C) or γ-hENaC (D). E, to investigate whether δ-hENaC is glycosylated, membrane-enriched fractions from oocytes expressing δβγ-hENaC were left untreated (−) or were treated (+) either with _N_-glycosidase F (PNGase F) or with endoglycosidase Hf (Endo Hf). δ-hENaC was detected by SDS-PAGE (10% gel) using an anti-HA antibody. F, schematics of α- and δ-hENaC showing the positions of the HA and V5 tag at the N/C terminus.
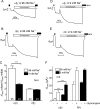
FIGURE 6.
Chymotrypsin can activate δβγ-hENaC, but the stimulatory effect is reduced compared with that on αβγ-hENaC. Oocytes were injected with cRNAs coding for αβγ- or δβγ-hENaC (each 1 ng per subunit) and incubated in 96 m
m
Na+ (open columns) or 9 m
m
Na+ solution (filled columns). A, B, D, and E, representative whole-cell current traces from αβγ- or δβγ-hENaC-expressing oocytes maintained in 96 m
m
Na+ solution (A and B) or in 9 m
m
Na+ solution (D and E) for 2 days after cRNA injection. During the recordings oocytes were superfused with 96 m
m
Na+ solution. The application of chymotrypsin (2 μg/ml) is indicated by the open bars. C, average ratios of Δ_I_ami measured after chymotrypsin to the initial Δ_I_ami (Δ_I_ami − chymotrypsin/Δ_I_ami − initial). Numbers inside the columns indicate the number of individual oocytes measured. N indicates number of different batches of oocytes. F, average Δ_I_ami values measured before (−) or after (+) exposure to chymotrypsin in one representative batch of oocytes; n indicates number of individual oocytes measured. ***, p < 0.001, unpaired t test.
FIGURE 7.
δβγ-hENaC stimulation by chymotrypsin is associated with the appearance of a cleavage fragment of δ-hENaC. α- and δ-hENaC constructs with an N-terminal HA tag and C-terminal V5 tag were used and co-expressed with wild-type β- and γ-hENaC. Oocytes were treated (+) for 5 min with chymotrypsin (2 μg/ml) or were left untreated (−). Biotinylated cell surface protein was analyzed by SDS-PAGE and Western blot using 10% gels (A and B) or 8% gels (C and D). Each blot represents one of at least seven similar blots. A–D, α-, β-, γ- and δ-hENaC were detected with anti-HA- (A), anti-β- (C), anti-γ (D), or anti-V5 antibody (B). Noninjected (n.i.) oocytes demonstrate the absence of a signal in oocytes that do not express ENaC. The arrows indicate cleavage products. E and F, to confirm that the biotinylated material was not contaminated by intracellular proteins, blots were routinely re-probed with an antibody against β-actin. One representative blot is shown for biotinylated proteins (E) and one for intracellular proteins (F); similar results were obtained for all the other blots. G, Schematics of α- and δ-hENaC showing the positions of the HA and V5 tag at the N/C terminus.
FIGURE 8.
Channels with δ-hENaC require the presence of γ-hENaC to be activated by chymotrypsin. A and B, experiments were performed in oocytes injected with cRNAs for δ-hENaC alone or δγ-hENaC (5 ng per subunit). Average Δ_I_ami values are shown for δ- and δγ-hENaC-expressing oocytes before (−) and after (+) exposure to chymotrypsin (2 μg/ml). N indicates number of different batches of oocytes; n indicates number of individual oocytes measured. ***, p < 0.001, paired t test.
FIGURE 9.
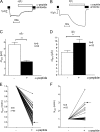
Effect of a 13-mer synthetic peptide on αβγ- or δβγ-hENaC. Oocytes were injected with cRNAs coding for αβγ- or δβγ-hENaC (each 2 ng per subunit) and were maintained in 9 m
m
Na+ solution after cRNA injection. A and B, individual whole-cell current trace of an oocyte expressing αβγ-hENaC (A) or δβγ-hENaC (B). Application of a 13-mer synthetic peptide (α-13) is indicated by the open bar. C and D, mean Δ_I_ami values before (−) and after (+) application of the α-13 peptide; experiments were performed as shown in A and B. E and F, relative change of Δ_I_ami in response to the α-13 peptide is shown for each individual oocyte tested in experiments as shown in A and B. Δ_I_ami values were normalized to the initial Δ_I_ami before the application of the peptide. Each line connects the Δ_I_ami values of an individual recording from an oocyte expressing either αβγ- (E) or δβγ-hENaC (F) measured before (−) and after (+) exposure to α-13. Data points indicated by the arrows are from the individual experiments shown in A and B. N indicates number of different batches of oocytes; n indicates number of individual oocytes measured. **, p < 0.01, ***, p < 0.001, paired t test.
FIGURE 10.
Single-channel _P_o of δβγ-hENaC is high in outside-out patches. The single-channel current traces shown were obtained from an outside-out patch of an oocyte expressing δβγ-hENaC. Closed and open levels are indicated by -c and -o, respectively. A, single-channel current traces recorded at different holding potentials (_V_hold). B, corresponding average single-channel I-V plot from six similar experiments as shown in A. To correct for the liquid junction potential occurring at the bridge/bath junction, the I-V plot was shifted to the left by 6 mV. S.E. values are indicated by vertical bars unless smaller than symbols. The I-V data were fitted using the Goldman-Hodgkin-Katz equation for a Na+ concentration ratio of [Na+]in/[Na+]out = 5/95 m
m
with a calculated reversal potential for Na+ (_E_Na) of 74.9 mV. C, continuous recording at _V_hold = −70 mV from the same outside-out patch as shown in A. Amiloride (10 μ
m
) was present in the bath solution as indicated above the trace by the black bar. Using amplitude histograms single-channel _P_o was determined in the presence and absence of amiloride during the periods indicated. The insets below show the indicated segments of the same current trace on an expanded time scale.
FIGURE 11.
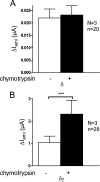
Chymotrypsin does not increase surface expression of δβγ-hENaC. Parallel detection of surface expression (RLU) and Δ_I_ami values in δβγ-hENaC-expressing oocytes before (−) and after (+) exposure to chymotrypsin (2 μg/ml) in a representative batch of oocytes (similar results were obtained in two other batches). A, channel surface expression was detected by insertion of a FLAG reporter epitope in the extracellular loop of the β-subunit and a chemiluminescence assay. Oocytes were injected with either 0.3 or 1 ng of cRNA per subunit (δβγ). Noninjected oocytes (n.i.) served as controls and showed negligible background luminescence. Numbers inside the columns indicate the number of individual oocytes measured. B, average Δ_I_ami values measured in parallel to the chemiluminescence assay; n indicates number of individual oocytes measured. ***, p < 0.001, paired t test; §§, p < 0.01; §§§, p < 0.001, unpaired t test.
Similar articles
- δβγ-ENaC is inhibited by CFTR but stimulated by cAMP in Xenopus laevis oocytes.
Rauh R, Hoerner C, Korbmacher C. Rauh R, et al. Am J Physiol Lung Cell Mol Physiol. 2017 Feb 1;312(2):L277-L287. doi: 10.1152/ajplung.00375.2016. Epub 2016 Dec 9. Am J Physiol Lung Cell Mol Physiol. 2017. PMID: 27941075 - Incorporation of the δ-subunit into the epithelial sodium channel (ENaC) generates protease-resistant ENaCs in Xenopus laevis.
Wichmann L, Vowinkel KS, Perniss A, Manzini I, Althaus M. Wichmann L, et al. J Biol Chem. 2018 May 4;293(18):6647-6658. doi: 10.1074/jbc.RA118.002543. Epub 2018 Mar 25. J Biol Chem. 2018. PMID: 29576549 Free PMC article. - Degenerin sites mediate proton activation of deltabetagamma-epithelial sodium channel.
Ji HL, Benos DJ. Ji HL, et al. J Biol Chem. 2004 Jun 25;279(26):26939-47. doi: 10.1074/jbc.M401143200. Epub 2004 Apr 14. J Biol Chem. 2004. PMID: 15084585 - ENaC activation by proteases.
Anand D, Hummler E, Rickman OJ. Anand D, et al. Acta Physiol (Oxf). 2022 May;235(1):e13811. doi: 10.1111/apha.13811. Epub 2022 Mar 21. Acta Physiol (Oxf). 2022. PMID: 35276025 Free PMC article. Review. - δ ENaC: a novel divergent amiloride-inhibitable sodium channel.
Ji HL, Zhao RZ, Chen ZX, Shetty S, Idell S, Matalon S. Ji HL, et al. Am J Physiol Lung Cell Mol Physiol. 2012 Dec 15;303(12):L1013-26. doi: 10.1152/ajplung.00206.2012. Epub 2012 Sep 14. Am J Physiol Lung Cell Mol Physiol. 2012. PMID: 22983350 Free PMC article. Review.
Cited by
- Epithelial Na + Channels Function as Extracellular Sensors.
Kashlan OB, Wang XP, Sheng S, Kleyman TR. Kashlan OB, et al. Compr Physiol. 2024 Mar 29;14(2):1-41. doi: 10.1002/cphy.c230015. Compr Physiol. 2024. PMID: 39109974 Review. - Varying Selection Pressure for a Na+ Sensing Site in Epithelial Na+ Channel Subunits Reflect Divergent Roles in Na+ Homeostasis.
Wang XP, Srinivasan P, El Hamdaoui M, Blobner BM, Grytz R, Kashlan OB. Wang XP, et al. Mol Biol Evol. 2024 Aug 2;41(8):msae162. doi: 10.1093/molbev/msae162. Mol Biol Evol. 2024. PMID: 39101592 Free PMC article. - The small molecule activator S3969 stimulates the epithelial sodium channel by interacting with a specific binding pocket in the channel's β-subunit.
Sure F, Einsiedel J, Gmeiner P, Duchstein P, Zahn D, Korbmacher C, Ilyaskin AV. Sure F, et al. J Biol Chem. 2024 Apr;300(4):105785. doi: 10.1016/j.jbc.2024.105785. Epub 2024 Feb 23. J Biol Chem. 2024. PMID: 38401845 Free PMC article. - Proteolytic Activation of the Epithelial Sodium Channel (ENaC): Its Mechanisms and Implications.
Aufy M, Hussein AM, Stojanovic T, Studenik CR, Kotob MH. Aufy M, et al. Int J Mol Sci. 2023 Dec 16;24(24):17563. doi: 10.3390/ijms242417563. Int J Mol Sci. 2023. PMID: 38139392 Free PMC article. Review. - Recording Sodium Self-Inhibition of Epithelial Sodium Channels Using Automated Electrophysiology in Xenopus Oocytes.
Lawong RY, May F, Etang EC, Vorrat P, George J, Weder J, Kockler D, Preller M, Althaus M. Lawong RY, et al. Membranes (Basel). 2023 May 19;13(5):529. doi: 10.3390/membranes13050529. Membranes (Basel). 2023. PMID: 37233590 Free PMC article.
References
- Kellenberger S., Schild L. (2002) Physiol. Rev. 82, 735–767 - PubMed
- Alvarez de la Rosa D., Canessa C. M., Fyfe G. K., Zhang P. (2000) Annu. Rev. Physiol. 62, 573–594 - PubMed
- Garty H., Palmer L. G. (1997) Physiol. Rev. 77, 359–396 - PubMed
- Rossier B. C., Pradervand S., Schild L., Hummler E. (2002) Annu. Rev. Physiol. 64, 877–897 - PubMed
- Drummond H. A., Furtado M. M., Myers S., Grifoni S., Parker K. A., Hoover A., Stec D. E. (2006) Am. J. Physiol. Cell Physiol. 290, C404–C410 - PubMed
Publication types
MeSH terms
Substances
LinkOut - more resources
Full Text Sources
Miscellaneous
