Structure of the BK potassium channel in a lipid membrane from electron cryomicroscopy - PubMed (original) (raw)
. 2009 Sep 10;461(7261):292-5.
doi: 10.1038/nature08291. Epub 2009 Aug 30.
Affiliations
- PMID: 19718020
- PMCID: PMC2797367
- DOI: 10.1038/nature08291
Structure of the BK potassium channel in a lipid membrane from electron cryomicroscopy
Liguo Wang et al. Nature. 2009.
Abstract
A long-sought goal in structural biology has been the imaging of membrane proteins in their membrane environments. This goal has been achieved with electron crystallography in those special cases where a protein forms highly ordered arrays in lipid bilayers. It has also been achieved by NMR methods in proteins up to 50 kilodaltons (kDa) in size, although milligram quantities of protein and isotopic labelling are required. For structural analysis of large soluble proteins in microgram quantities, an increasingly powerful method that does not require crystallization is single-particle reconstruction from electron microscopy of cryogenically cooled samples (electron cryomicroscopy (cryo-EM)). Here we report the first single-particle cryo-EM study of a membrane protein, the human large-conductance calcium- and voltage-activated potassium channel (BK), in a lipid environment. The new method is called random spherically constrained (RSC) single-particle reconstruction. BK channels, members of the six-transmembrane-segment (6TM) ion channel family, were reconstituted at low density into lipid vesicles (liposomes), and their function was verified by a potassium flux assay. Vesicles were also frozen in vitreous ice and imaged in an electron microscope. From images of 8,400 individual protein particles, a three-dimensional (3D) reconstruction of the BK channel and its membrane environment was obtained at a resolution of 1.7-2.0 nm. Not requiring the formation of crystals, the RSC approach promises to be useful in the structural study of many other membrane proteins as well.
Figures
Fig. 1
BK channel structure and specific potassium permeability. a, Topology and domain structure of the hSlo α-subunit of the BK channel. Residue numbers of native hSlo are shown in blue; the His and FLAG tags add an additional 14 residues to the N-terminus in our construct. b, Fluorescence assay of proteoliposome membrane potential. c, Normalized fluorescence as a function of calculated potassium equilibrium potential. Signals from empty POPC liposomes (Ctrl) or liposomes in the presence of 1 nM Valinomycin, a K+ ionophore (Ctrl+Val) are compared with those from BK proteoliposomes alone or with external addition of the blockers 10 mM Ba2+ or 30 μM iberiotoxin.
Fig. 2
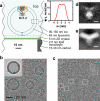
Cryo-EM specimen and image processing. a, Scale drawing of the tethered proteoliposome system. The inset shows the electron-scattering profile of the POPC bilayer. b, EM image with the periodic crystal information removed. The inset shows a simulation in which the membrane profile and three copies of the BK structure are oriented to reproduce the proteoliposome image underneath. c, The same micrograph after subtraction of modeled membranes. BK channel particles were selected manually (white boxes). d,e, Central sections of the 3D reconstruction of BK channels after subtraction of the membrane density and after a patch of membrane was computationally restored, respectively; scale bar is 5 nm.
Fig. 3
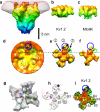
Structure of the transmembrane region. a, Surface rendering of the membrane-subtracted, inside-out BK channel map, obtained from 3400 images of particles in large vesicles. Superimposed is the membrane density (mesh). Maps were filtered to a resolution of 2.0 nm; isosurfaces are colored according to the _z_-coordinate. b, c, Surface renderings of Kv1.2 and MlotiK X-ray structures, filtered to 1.7 nm resolution for comparison. d, Extracellular aspect of the membrane-restored reconstruction of BK. e–f, Corresponding extracellular views of Kv1.2 and MlotiK. g, Extracellular aspect of the membrane-subtracted BK map (solid) with transmembrane helices of the docked Kv1.2 structure superimposed. h, Section (2 nm thick) of the membrane-subtracted BK map (mesh) near the membrane center with the corresponding Kv1.2 helices superimposed. i, Surface rendering of the Kv1.2 transmembrane region, but with a resolution of 0.3 nm.
Figure 4
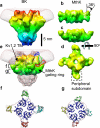
Structure of the gating ring. a, Side view of BK and membrane, rotated 45° about the vertical axis from the view in Fig. 3a. b, Surface rendering of the “closed” MthK gating ring filtered to 1.7 nm resolution. c–d, The MthK gating ring modified by a 36° rotation of the peripheral domains. e, View of the BK map (mesh) with Kv1.2 transmembrane region and MthK gating ring docked. All models are colored according to the _z_-coordinate. The blue triangle and red polygon indicate possible locations for the N-terminal region and the S0–S1 linker, respectively. The green oval is the proposed location of the S0 helix. f, g, “Top” views of the BK map and docked MthK gating ring, in the sections marked in part e.
Similar articles
- Random Spherically Constrained Single-Particle (RSC) Method to Study Voltage-Gated Ion Channels.
Wang L. Wang L. Methods Mol Biol. 2018;1684:265-277. doi: 10.1007/978-1-4939-7362-0_20. Methods Mol Biol. 2018. PMID: 29058198 - Molecular basis for differential modulation of BK channel voltage-dependent gating by auxiliary γ subunits.
Li Q, Fan F, Kwak HR, Yan J. Li Q, et al. J Gen Physiol. 2015 Jun;145(6):543-54. doi: 10.1085/jgp.201511356. J Gen Physiol. 2015. PMID: 26009545 Free PMC article. - Large-conductance Ca2+- and voltage-gated K+ channels form and break interactions with membrane lipids during each gating cycle.
Tian Y, Heinemann SH, Hoshi T. Tian Y, et al. Proc Natl Acad Sci U S A. 2019 Apr 23;116(17):8591-8596. doi: 10.1073/pnas.1901381116. Epub 2019 Apr 9. Proc Natl Acad Sci U S A. 2019. PMID: 30967508 Free PMC article. - Determining the Crystal Structure of TRPV6.
Saotome K, Singh AK, Sobolevsky AI. Saotome K, et al. In: Kozak JA, Putney JW Jr, editors. Calcium Entry Channels in Non-Excitable Cells. Boca Raton (FL): CRC Press/Taylor & Francis; 2018. Chapter 14. In: Kozak JA, Putney JW Jr, editors. Calcium Entry Channels in Non-Excitable Cells. Boca Raton (FL): CRC Press/Taylor & Francis; 2018. Chapter 14. PMID: 30299652 Free Books & Documents. Review. - Emerging issues of connexin channels: biophysics fills the gap.
Harris AL. Harris AL. Q Rev Biophys. 2001 Aug;34(3):325-472. doi: 10.1017/s0033583501003705. Q Rev Biophys. 2001. PMID: 11838236 Review.
Cited by
- Structural biology and molecular pharmacology of voltage-gated ion channels.
Huang J, Pan X, Yan N. Huang J, et al. Nat Rev Mol Cell Biol. 2024 Nov;25(11):904-925. doi: 10.1038/s41580-024-00763-7. Epub 2024 Aug 5. Nat Rev Mol Cell Biol. 2024. PMID: 39103479 Review. - Liposomes on a streptavidin crystal: a system to study membrane proteins by cryo-EM.
Wang L, Sigworth FJ. Wang L, et al. Methods Enzymol. 2010;481:147-64. doi: 10.1016/S0076-6879(10)81007-9. Methods Enzymol. 2010. PMID: 20887857 Free PMC article. - Cryo-EM Grid Preparation of Membrane Protein Samples for Single Particle Analysis.
Sgro GG, Costa TRD. Sgro GG, et al. Front Mol Biosci. 2018 Jul 31;5:74. doi: 10.3389/fmolb.2018.00074. eCollection 2018. Front Mol Biosci. 2018. PMID: 30131964 Free PMC article. Review. - Structure of the human BK channel Ca2+-activation apparatus at 3.0 A resolution.
Yuan P, Leonetti MD, Pico AR, Hsiung Y, MacKinnon R. Yuan P, et al. Science. 2010 Jul 9;329(5988):182-6. doi: 10.1126/science.1190414. Epub 2010 May 27. Science. 2010. PMID: 20508092 Free PMC article. - To Be or Not to Be an Ion Channel: Cryo-EM Structures Have a Say.
Chen GL, Li J, Zhang J, Zeng B. Chen GL, et al. Cells. 2023 Jul 17;12(14):1870. doi: 10.3390/cells12141870. Cells. 2023. PMID: 37508534 Free PMC article. Review.
References
- Raunser S, Walz T. Electron crystallography as a technique to study the structure on membrane proteins in a lipidic environment. Annual review of biophysics. 2009;38:89. - PubMed
- Frank J. Three-Dimensional Electron Microscopy of Macromolecular Assemblies. Oxford University Press; Oxford: 2006.
MeSH terms
Substances
Grants and funding
- R01 NS021501-19/NS/NINDS NIH HHS/United States
- P01 GM062580/GM/NIGMS NIH HHS/United States
- R01 NS021501-22/NS/NINDS NIH HHS/United States
- R01 NS021501-19S1/NS/NINDS NIH HHS/United States
- P01 GM062580-070007/GM/NIGMS NIH HHS/United States
- P01 GM062580-080007/GM/NIGMS NIH HHS/United States
- R01 NS021501-24/NS/NINDS NIH HHS/United States
- R01 NS021501-23/NS/NINDS NIH HHS/United States
- R01 NS021501/NS/NINDS NIH HHS/United States
- S10 RR014739-018020/RR/NCRR NIH HHS/United States
- S10 RR014739-01/RR/NCRR NIH HHS/United States
- R01 NS021501-20/NS/NINDS NIH HHS/United States
- P01 GM062580-06A10007/GM/NIGMS NIH HHS/United States
- R01 NS021501-21/NS/NINDS NIH HHS/United States
LinkOut - more resources
Full Text Sources
Other Literature Sources


