Visualization of ATP levels inside single living cells with fluorescence resonance energy transfer-based genetically encoded indicators - PubMed (original) (raw)
Visualization of ATP levels inside single living cells with fluorescence resonance energy transfer-based genetically encoded indicators
Hiromi Imamura et al. Proc Natl Acad Sci U S A. 2009.
Abstract
Adenosine 5'-triphosphate (ATP) is the major energy currency of cells and is involved in many cellular processes. However, there is no method for real-time monitoring of ATP levels inside individual living cells. To visualize ATP levels, we generated a series of fluorescence resonance energy transfer (FRET)-based indicators for ATP that were composed of the epsilon subunit of the bacterial F(o)F(1)-ATP synthase sandwiched by the cyan- and yellow-fluorescent proteins. The indicators, named ATeams, had apparent dissociation constants for ATP ranging from 7.4 muM to 3.3 mM. By targeting ATeams to different subcellular compartments, we unexpectedly found that ATP levels in the mitochondrial matrix of HeLa cells are significantly lower than those of cytoplasm and nucleus. We also succeeded in measuring changes in the ATP level inside single HeLa cells after treatment with inhibitors of glycolysis and/or oxidative phosphorylation, revealing that glycolysis is the major ATP-generating pathway of the cells grown in glucose-rich medium. This was also confirmed by an experiment using oligomycin A, an inhibitor of F(o)F(1)-ATP synthase. In addition, it was demonstrated that HeLa cells change ATP-generating pathway in response to changes of nutrition in the environment.
Conflict of interest statement
The authors declare no conflict of interest.
Figures
Fig. 1.
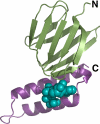
Three-dimensional structure of Bacillus sp. PS3 ε subunit complexed with ATP (14). The N-terminal β-sandwich domain (residues 1–84) and C-terminal α-helical domain (residues 85–133) are colored green and magenta, respectively. ATP is represented as a cyan sphere model.
Fig. 2.
FRET-based ATP probes, ATeam. (A) Schematic drawing of AT1.03 probe. Variants of CFP (mseCFP) and YFP (cp173-mVenus) were connected by the ε subunit of Bacillus subtilis FoF1-ATP synthase. In the ATP-free form (left), extended and flexible conformations of the ε subunit separate the two fluorescent proteins, resulting in low FRET efficiency. In the ATP-bound form, the ε subunit retracts to draw the two fluorescent proteins close to each other, which increases FRET efficiency. (B) ATP-dependent fluorescence spectral change of AT1.03 in vitro. Fluorescence emission of AT1.03 proteins at various ATP concentrations ([ATP]) and at 37 °C in 50 mM Mops-KOH (pH 7.3), 50 mM KCl, 0.5 mM MgCl2, and 0.05% Triton X-100 was measured by exciting with 435 nm light. (C) ATP-dependent fluorescence emission ratio (R) changes of four ATeam proteins in vitro. The fraction of emission ratio (527/475 nm) change was plotted against [ATP]. Fluorescence of ATeam proteins was measured as in (B). Plots were fitted using a Hill equation: ΔR/R = ΔR x [ATP]n/([ATP]n + _K_dn). The apparent dissociation constant (_K_d) and Hill coefficient (n) were calculated to be 7.4 μM and 1.7 (AT3.10), 14 μM and 2.0 (AT3.10MGK), 1.2 mM and 2.1 (AT1.03YEMK), and 3.3 mM and 2.1 (AT1.03), respectively.
Fig. 3.
Characterization of purified AT1.03 in vitro. (A) Nucleotide selectivity of AT1.03. The fluorescence emission ratio (527/475 nm) at 37 °C was plotted against nucleotide concentrations. Red filled circle, ATP; blue filled circle, ADP; green open square, GTP; orange open circle, dATP. Plots were fitted with Hill equations; R = (Rmax − Rmin) x [S]n/([S]n + _K_dn) + Rmin, where Rmax and Rmin are the maximum and minimum fluorescence ratios, respectively, _K_d is the apparent dissociation constant, and n is a Hill coefficient. (B) pH dependence of AT1.03. The fluorescence ratios (527/475 nm) at 37 °C at 0, 2, 4, and 8 mM ATP in the pH range of 6.3–8.3 are shown. The buffer contained 50 mM Mops-KOH (pH 6.3–7.5) or Hepes-KOH (pH 7.7–8.3), 50 mM potassium chloride, 0.5 mM magnesium chloride, and 0.05% Triton X-100. (C) Reaction rate constants of AT1.03. Apparent rate constants (_k_app = _k_on[ATP] + _k_off) at 37 °C, which were determined by fitting the CFP fluorescence decrease after ATP addition with a single exponential equation, were plotted against ATP concentrations ([ATP]). From a linear fit to the plot, _k_on and koff were calculated as 1.7 × 10⁻² mM−1s−1 and 9.8 × 10⁻² s−1, respectively. (D) Dependence of _K_d on temperature. _K_d values for ATP were measured as in (A) at 25, 28, 31, 34, 37, and 40 °C.
Fig. 4.
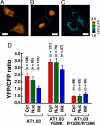
Comparison of ATP concentrations ([ATP]) between different cellular compartments. (A–C) Expression of ATeam in different cellular compartments. Ratiometric pseudocolor images of AT1.03 expressed in cytoplasm (A), nucleus (B), and mitochondria (C) of HeLa cells. White lines represent cell outline. (Scale bar, 20 μm.) (D) Comparison of YFP/CFP emission ratio of ATeams in different cellular compartments. Three ATeams (AT1.03, AT1.03YEMK, AT1.03R122K/R126K), which have different affinity to ATP, were expressed in cytoplasm, nucleus, or mitochondria of HeLa cells. The ratio was calculated from fluorescent images. The numbers of cells used for calculating the ratio are indicated. Error bars are standard deviation of ratios.
Fig. 5.
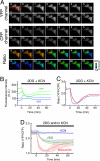
Monitoring of cytoplasmic ATP levels of HeLa cells. (A) Sequential wide-field images of YFP (top), CFP (middle) and YFP/CFP emission ratio (bottom, pseudocolored) of a HeLa cell expressing AT1.03. Inhibitors of glycolysis (10 mM 2-deoxyglucose [2DG]) and OXPHOS (1 mM potassium cyanide [KCN]) were added at time = 0 (min). Elapsed time (in minutes) after addition of the inhibitors is shown to the top left of the cells. Images were obtained at 37 °C. (Scale bar, 20 μm). (B) Time course of fluorescence intensity of CFP (blue) and YFP (green) inside ROI1 (solid line) and ROI2 (dashed line) depicted in the top-left image of (A). (C) Time course of YFP/CFP emission ratio inside ROI1 (red solid line) and ROI2 (blue dashed line) depicted in the top-left image of (A). (D) Time course of averaged YFP/CFP emission ratio of HeLa cells expressing AT1.03. 2DG and/or potassium azide was added at time = 0 (min). Red, 2DG and KCN (n = 5); green, 2DG (n = 6); blue, KCN (n = 4). Error bars are standard deviations between measurements.
Fig. 6.
Nutrient dependent alternation of ATP-generating pathway of HeLa cells. Sensitivity of intracellular ATP level to an OXPHOS inhibitor, oligomycin A, was examined for HeLa cells grown in glucose (A) or galactose (B) medium. Time courses of YFP/CFP emission ratio of cells expressing AT1.03, which were grown in DMEM without pyruvate containing 10 mM glucose (A) or 10 mM galactose (B), were monitored as in Fig. 5. Oligomycin A (10 μg/ml) was added to the medium at a time indicated by an arrow head.
Similar articles
- Designing, construction and characterization of genetically encoded FRET-based nanosensor for real time monitoring of lysine flux in living cells.
Ameen S, Ahmad M, Mohsin M, Qureshi MI, Ibrahim MM, Abdin MZ, Ahmad A. Ameen S, et al. J Nanobiotechnology. 2016 Jun 22;14(1):49. doi: 10.1186/s12951-016-0204-y. J Nanobiotechnology. 2016. PMID: 27334743 Free PMC article. - MRT letter: Expression of ATP sensor protein in Caenorhabditis elegans.
Kishikawa J, Fujikawa M, Imamura H, Yasuda K, Noji H, Ishii N, Mitani S, Yokoyama K. Kishikawa J, et al. Microsc Res Tech. 2012 Jan;75(1):15-9. doi: 10.1002/jemt.21103. Epub 2011 Oct 28. Microsc Res Tech. 2012. PMID: 22038755 - Three-color Förster resonance energy transfer within single F₀F₁-ATP synthases: monitoring elastic deformations of the rotary double motor in real time.
Ernst S, Düser MG, Zarrabi N, Börsch M. Ernst S, et al. J Biomed Opt. 2012 Jan;17(1):011004. doi: 10.1117/1.JBO.17.1.011004. J Biomed Opt. 2012. PMID: 22352638 - Development of probes for cellular functions using fluorescent proteins and fluorescence resonance energy transfer.
Miyawaki A. Miyawaki A. Annu Rev Biochem. 2011;80:357-73. doi: 10.1146/annurev-biochem-072909-094736. Annu Rev Biochem. 2011. PMID: 21529159 Review. - New tools for redox biology: From imaging to manipulation.
Bilan DS, Belousov VV. Bilan DS, et al. Free Radic Biol Med. 2017 Aug;109:167-188. doi: 10.1016/j.freeradbiomed.2016.12.004. Epub 2016 Dec 6. Free Radic Biol Med. 2017. PMID: 27939954 Review.
Cited by
- Single-cell metabolic imaging reveals a SLC2A3-dependent glycolytic burst in motile endothelial cells.
Wu D, Harrison DL, Szasz T, Yeh CF, Shentu TP, Meliton A, Huang RT, Zhou Z, Mutlu GM, Huang J, Fang Y. Wu D, et al. Nat Metab. 2021 May;3(5):714-727. doi: 10.1038/s42255-021-00390-y. Epub 2021 May 24. Nat Metab. 2021. PMID: 34031595 Free PMC article. - Recent progress in developing fluorescent probes for imaging cell metabolites.
Hong S, Pawel GT, Pei R, Lu Y. Hong S, et al. Biomed Mater. 2021 May 24;16(4):10.1088/1748-605X/abfd11. doi: 10.1088/1748-605X/abfd11. Biomed Mater. 2021. PMID: 33915523 Free PMC article. Review. - Monitoring and modeling of lymphocytic leukemia cell bioenergetics reveals decreased ATP synthesis during cell division.
Kang JH, Katsikis G, Li Z, Sapp KM, Stockslager MA, Lim D, Vander Heiden MG, Yaffe MB, Manalis SR, Miettinen TP. Kang JH, et al. Nat Commun. 2020 Oct 5;11(1):4983. doi: 10.1038/s41467-020-18769-y. Nat Commun. 2020. PMID: 33020492 Free PMC article. - Light-Controlled Modulation and Analysis of Neuronal Functions.
Matera C, Bregestovski P. Matera C, et al. Int J Mol Sci. 2022 Oct 26;23(21):12921. doi: 10.3390/ijms232112921. Int J Mol Sci. 2022. PMID: 36361710 Free PMC article. - Subcellular NAMPT-mediated NAD+ salvage pathways and their roles in bioenergetics and neuronal protection after ischemic injury.
Wang X, Zhang Z, Zhang N, Li H, Zhang L, Baines CP, Ding S. Wang X, et al. J Neurochem. 2019 Dec;151(6):732-748. doi: 10.1111/jnc.14878. Epub 2019 Oct 16. J Neurochem. 2019. PMID: 31553812 Free PMC article.
References
- Finger TE, et al. ATP signaling is crucial for communication from taste buds to gustatory nerves. Science. 2005;310:1495–1499. - PubMed
- Davalos D, et al. ATP mediates rapid microglial response to local brain injury in vivo. Nat Neurosci. 2005;8:752–758. - PubMed
- Masse K, Bhamra S, Eason R, Dale N, Jones EA. Purine-mediated signalling triggers eye development. Nature. 2007;449:1058–1062. - PubMed
- Kennedy HJ, et al. Glucose generates sub-plasma membrane ATP microdomains in single islet β-cells. Potential role for strategically located mitochondria. J Biol Chem. 1999;274:13281–13291. - PubMed
Publication types
MeSH terms
Substances
LinkOut - more resources
Full Text Sources
Other Literature Sources
Molecular Biology Databases


