Schizophrenia is associated with an increase in cortical microRNA biogenesis - PubMed (original) (raw)
Comparative Study
. 2010 Dec;15(12):1176-89.
doi: 10.1038/mp.2009.84. Epub 2009 Sep 1.
Affiliations
- PMID: 19721432
- PMCID: PMC2990188
- DOI: 10.1038/mp.2009.84
Free PMC article
Comparative Study
Schizophrenia is associated with an increase in cortical microRNA biogenesis
N J Beveridge et al. Mol Psychiatry. 2010 Dec.
Free PMC article
Abstract
MicroRNA expression profiling and quantitative reverse transcription-PCR analysis of the superior temporal gyrus and the dorsolateral prefrontal cortex revealed a significant schizophrenia-associated increase in global microRNA expression. This change was associated with an elevation of primary microRNA processing and corresponded with an increase in the microprocessor component DGCR8. The biological implications for this extensive increase in gene silencing are profound, and were exemplified by members of the miR-15 family and other related microRNA, which were significantly upregulated in both brain regions. This functionally convergent influence is overrepresented in pathways involved in synaptic plasticity and includes many genes and pathways associated with schizophrenia, some of which were substantiated in vitro by reporter gene assay. Given the magnitude of microRNA changes and their wide sphere of influence, this phenomenon could represent an important dimension in the pathogenesis of schizophrenia.
Figures
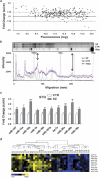
Figure 1
Schizophrenia-associated miRNA expression in the superior temporal gyrus (STG). (a) Average fold change of miRNA expression (schizophrenia to control) was plotted against log2-transformed fluorescence values (_n_=17 matched pairs). A global increase in miRNA expression in the STG in schizophrenia is indicated by the majority of miRNA showing a ratio >1.0. (b) Electrophoresis of dephosphorylated total RNA (pooled samples) labeled with polynucleotide kinase (PNK). Whole lane densitometry of the phosphor image indicated an increase in small RNA in the schizophrenia cohort (pink trace) compared with the controls (blue trace), particularly in the small RNA fraction (20–24 nt) region corresponding to most miRNAs (indicated by long arrow). Densitometry was normalized to the ∼75-nt band in each lane (indicated by short arrow). (c) Increased miRNA expression in the STG was validated using quantitative real-time reverse transcription-PCR (Q-PCR) (_n_=21 matched pairs). Level of expression for controls was set at 1. Bars are mean+s.e.m. *P<0.05; **P<0.01; ***P<0.001;+miR-16 and miR-19a were significant by _t_-test but were found to correlate with pH (_r_=−0.459 and −0.443, respectively) and fell short of significance by analysis of covariance. (d) Q-PCR expression data hierarchically clustered (correlation uncentered, average linkage; Cluster 3.0). Blue indicates low expression and yellow indicates high expression (Java Treeview;
http://www.sourceforge.net/projects/jtreeview/files
).
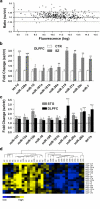
Figure 2
Schizophrenia-associated miRNA expression in the dorsolateral prefrontal cortex (DLPFC). (a) miRNA expression in the DLPFC in schizophrenia was characterized by the global upregulation illustrated in this scatter plot (see Figure 1a for description), with the majority of individual miRNAs showing a ratio >1.0. (b) Increased miRNA expression in the DLPFC was validated using quantitative real-time reverse transcription-PCR (Q-PCR) (_n_=15 matched pairs). Level of expression for controls was set at 1. (c) Further Q-PCR expression analysis indicated that 11 miRNAs with altered expression showed an upregulation in both the superior temporal gyrus and DLPFC. Bars indicate mean fold change+s.e.m. *P<0.05; **P<0.01; ***P<0.001. (d) Q-PCR expression data were subjected to hierarchical clustering and heat map, shown as described in Figure 1d.
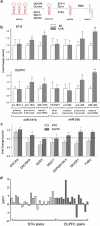
Figure 3
Alterations in miRNA processing in schizophrenia. (a) Simplified schematic of miRNA biogenesis showing genes involved in key enzymatic steps. (b) Primary, precursor and mature transcripts for miR-181b were analyzed by Q-PCR in the superior temporal gyrus (STG). The primary transcript was not altered in schizophrenia; however, the precursor and mature transcripts were both upregulated 1.4-fold (_P_=0.048) and 1.7-fold (_P_=0.039), respectively. The host gene of miR-26b (CDTSP1) and primary transcript were not altered. The precursor and mature miR-26b transcript were both upregulated in schizophrenia (1.5-fold (_P_=0.023) and 1.9-fold (_P_=0.001), respectively). In the dorsolateral prefrontal cortex (DLPFC), a similar trend followed. Host gene and primary transcripts were not altered in schizophrenia. For miR-181b, the precursor and mature were upregulated 1.5-fold (_P_=0.043) and 1.4-fold (_P_=0.039), respectively. For miR-26b, the precursor and mature were upregulated 1.6-fold (_P_=0.046) and 2.2-fold (_P_=0.001), respectively. (c) Expression of miRNA biogenesis genes was analyzed in the STG (_n_=21 matched pairs) and the DLPFC (_n_=15 matched pairs). DGCR8 was significantly upregulated in the STG and DLPFC, whereas Drosha and Dicer were significantly upregulated in the DLPFC only. Bars indicate mean fold change (schizophrenia to control)+s.e.m. *P<0.05; **P<0.01 unpaired Student's _t_-test. (d) DGCR8 expression was determined by Q-PCR in matched paired samples (SZ vs CTR). DGCR8 was upregulated in 16 out of 21 matched pairs of STG tissue and in 13 out of 15 matched pairs of DLPFC tissue.
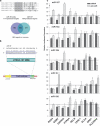
Figure 4
Regulation of schizophrenia-associated reporter gene constructs by miRNA. (a) Sequence alignment showing miR-107 and the miR-15 family seed region homology (gray highlight). Together, the two groups were predicted to have many target genes in common (Venn diagram). (b) The pMIR-REPORT miRNA expression reporter system contains a firefly luciferase gene under the control of the cytomegalovirus (CMV) promoter. Putative miRNA recognition elements for various schizophrenia candidate genes were inserted into the multiple cloning site in the 3′-UTR of the firefly luciferase gene (HTR2A shown as an example). (c) A matrix chart showing the relative activity of reporter gene constructs (_x_-axis) in response to co-transfected miRNA (dark bars) or their cognate anti-miR (light bars). Relative luciferase activity for each reporter/miRNA/anti-miR combination was expressed as a percentage of the response to scrambled controls (+s.d.; *P<0.05).
Figure 5
Model for miRNA-associated dysregulation of synaptic structure and function in schizophrenia. The microprocessor activity is elevated in cortical nuclei as a consequence of a schizophrenia-associated increase in DGCR8 expression. The increase in pri-miRNA processing results in an increase in pre-miRNAs, which are exported from the nucleus and processed without delay by Exportin-5 (XPO5) and Dicer, respectively. Mature miRNAs are recruited into the RNA-induced silencing complex (RISC) and associate with the 3′-UTR of their target transcripts encoding synaptic components (among other proteins), such as neurotropins/ligands (BDNF, Reelin), neurotransmitter receptors (GRM7, GRIN3A, HTR2A, DRD1) and structural components of the post-synaptic density (DLG4). This association reduces the stability of the transcript and reduces its ability to undergo translation. Inappropriate levels of mature miRNA and gene silencing (red arrow) result in the reduction of synaptic proteins and consequently a loss of synaptic structure and function.
Similar articles
- Upregulation of dicer and microRNA expression in the dorsolateral prefrontal cortex Brodmann area 46 in schizophrenia.
Santarelli DM, Beveridge NJ, Tooney PA, Cairns MJ. Santarelli DM, et al. Biol Psychiatry. 2011 Jan 15;69(2):180-7. doi: 10.1016/j.biopsych.2010.09.030. Epub 2010 Dec 15. Biol Psychiatry. 2011. PMID: 21111402 - A direct regulatory link between microRNA-137 and SHANK2: implications for neuropsychiatric disorders.
de Sena Cortabitarte A, Berkel S, Cristian FB, Fischer C, Rappold GA. de Sena Cortabitarte A, et al. J Neurodev Disord. 2018 Apr 17;10(1):15. doi: 10.1186/s11689-018-9233-1. J Neurodev Disord. 2018. PMID: 29665782 Free PMC article. - MicroRNA expression profiling in the prefrontal cortex of individuals affected with schizophrenia and bipolar disorders.
Kim AH, Reimers M, Maher B, Williamson V, McMichael O, McClay JL, van den Oord EJ, Riley BP, Kendler KS, Vladimirov VI. Kim AH, et al. Schizophr Res. 2010 Dec;124(1-3):183-91. doi: 10.1016/j.schres.2010.07.002. Epub 2010 Aug 2. Schizophr Res. 2010. PMID: 20675101 Free PMC article. - Specific relationship between prefrontal neuronal N-acetylaspartate and activation of the working memory cortical network in schizophrenia.
Bertolino A, Esposito G, Callicott JH, Mattay VS, Van Horn JD, Frank JA, Berman KF, Weinberger DR. Bertolino A, et al. Am J Psychiatry. 2000 Jan;157(1):26-33. doi: 10.1176/ajp.157.1.26. Am J Psychiatry. 2000. PMID: 10618009 Review. - Dopaminergic control of working memory and its relevance to schizophrenia: a circuit dynamics perspective.
Tanaka S. Tanaka S. Neuroscience. 2006 Apr 28;139(1):153-71. doi: 10.1016/j.neuroscience.2005.08.070. Epub 2005 Dec 1. Neuroscience. 2006. PMID: 16324800 Review.
Cited by
- The miR-124-AMPAR pathway connects polygenic risks with behavioral changes shared between schizophrenia and bipolar disorder.
Namkung H, Yukitake H, Fukudome D, Lee BJ, Tian M, Ursini G, Saito A, Lam S, Kannan S, Srivastava R, Niwa M, Sharma K, Zandi P, Jaaro-Peled H, Ishizuka K, Chatterjee N, Huganir RL, Sawa A. Namkung H, et al. Neuron. 2023 Jan 18;111(2):220-235.e9. doi: 10.1016/j.neuron.2022.10.031. Epub 2022 Nov 14. Neuron. 2023. PMID: 36379214 Free PMC article. - Stress-Related Roles of Exosomes and Exosomal miRNAs in Common Neuropsychiatric Disorders.
Chamakioti M, Chrousos GP, Kassi E, Vlachakis D, Yapijakis C. Chamakioti M, et al. Int J Mol Sci. 2024 Jul 29;25(15):8256. doi: 10.3390/ijms25158256. Int J Mol Sci. 2024. PMID: 39125827 Free PMC article. Review. - MicroRNA dysregulation in neuropsychiatric disorders and cognitive dysfunction.
Xu B, Hsu PK, Karayiorgou M, Gogos JA. Xu B, et al. Neurobiol Dis. 2012 May;46(2):291-301. doi: 10.1016/j.nbd.2012.02.016. Epub 2012 Mar 3. Neurobiol Dis. 2012. PMID: 22406400 Free PMC article. Review. - MicroRNA-338 Attenuates Cortical Neuronal Outgrowth by Modulating the Expression of Axon Guidance Genes.
Kos A, Klein-Gunnewiek T, Meinhardt J, Loohuis NFMO, van Bokhoven H, Kaplan BB, Martens GJ, Kolk SM, Aschrafi A. Kos A, et al. Mol Neurobiol. 2017 Jul;54(5):3439-3452. doi: 10.1007/s12035-016-9925-z. Epub 2016 May 14. Mol Neurobiol. 2017. PMID: 27180071 Free PMC article. - Polymorphisms in MicroRNA Genes And Genes Involving in NMDAR Signaling and Schizophrenia: A Case-Control Study in Chinese Han Population.
Zhang Y, Fan M, Wang Q, He G, Fu Y, Li H, Yu S. Zhang Y, et al. Sci Rep. 2015 Aug 10;5:12984. doi: 10.1038/srep12984. Sci Rep. 2015. PMID: 26257337 Free PMC article.
References
- Harrison PJ. Schizophrenia: a disorder of neurodevelopment. Curr Opin Neurobiol. 1997;7:285–289. - PubMed
- Mirnics K, Middleton FA, Marquez A, Lewis DA, Levitt P. Molecular characterization of schizophrenia viewed by microarray analysis of gene expression in prefrontal cortex. Neuron. 2000;28:53–67. - PubMed
- Weidenhofer J, Bowden NA, Scott RJ, Tooney PA. Altered gene expression in the amygdala in schizophrenia: up-regulation of genes located in the cytomatrix active zone. Mol Cell Neurosci. 2006;31:243–250. - PubMed
Publication types
MeSH terms
Substances
LinkOut - more resources
Full Text Sources
Other Literature Sources
Medical


