Inflammatory proprotein convertase-matrix metalloproteinase proteolytic pathway in antigen-presenting cells as a step to autoimmune multiple sclerosis - PubMed (original) (raw)
. 2009 Oct 30;284(44):30615-26.
doi: 10.1074/jbc.M109.041244. Epub 2009 Sep 2.
Albert G Remacle, Alexei Y Savinov, Andrei V Chernov, Piotr Cieplak, Ilian A Radichev, Roy Williams, Tatiana N Shiryaeva, Katarzyna Gawlik, Tatiana I Postnova, Boris I Ratnikov, Alexei M Eroshkin, Khatereh Motamedchaboki, Jeffrey W Smith, Alex Y Strongin
Affiliations
- PMID: 19726693
- PMCID: PMC2781616
- DOI: 10.1074/jbc.M109.041244
Inflammatory proprotein convertase-matrix metalloproteinase proteolytic pathway in antigen-presenting cells as a step to autoimmune multiple sclerosis
Sergey A Shiryaev et al. J Biol Chem. 2009.
Abstract
Multiple sclerosis (MS) is a disease of the central nervous system with autoimmune etiology. Susceptibility to MS is linked to viral and bacterial infections. Matrix metalloproteinases (MMPs) play a significant role in the fragmentation of myelin basic protein (MBP) and demyelination. The splice variants of the single MBP gene are expressed in the oligodendrocytes of the central nervous system (classic MBP) and in the immune cells (Golli-MBPs). Our data suggest that persistent inflammation caused by environmental risk factors is a step to MS. We have discovered biochemical evidence suggesting the presence of the inflammatory proteolytic pathway leading to MS. The pathway involves the self-activated furin and PC2 proprotein convertases and membrane type-6 MMP (MT6-MMP/MMP-25) that is activated by furin/PC2. These events are followed by MMP-25 proteolysis of the Golli-MBP isoforms in the immune system cells and stimulation of the specific autoimmune T cell clones. It is likely that the passage of these autoimmune T cell clones through the disrupted blood-brain barrier to the brain and the recognition of neuronal, classic MBP causes inflammation leading to the further up-regulation of the activity of the multiple individual MMPs, the massive cleavage of MBP in the brain, demyelination, and MS. In addition to the cleavage of Golli-MBPs, MMP-25 proteolysis readily inactivates crystallin alphaB that is a suppressor of MS. These data suggest that MMP-25 plays an important role in MS pathology and that MMP-25, especially because of its restricted cell/tissue expression pattern and cell surface/lipid raft localization, is a promising drug target in MS.
Figures
FIGURE 1.
Representative immunostaining of the healthy and MS brain sections. A, protein extracts (25 μg of total protein each) from a healthy total brain and medulla oblongata (left and right lines, respectively) and from the plaque area of the two MS brain samples were analyzed by Western blotting with the MBP antibody. The extracts were purchased from BioChain Institute (Hayward, CA). The representative samples are shown. Right lane, purified MBP (10 ng). B, immunostaining of the brain sections with the MBP and 2′,3′-cyclic nucleotide 3′-phosphodiesterase (CNPase) antibodies. The staining with the primary antibodies was followed by a diaminobenzidine-based detection method. A well demarcated edge (right) is visible between the plaque and the normal brain area. Magnification, ×160. Inset, the phagocytic macrophages (identified by their characteristic size and morphology) co-localize with fragmented MBP (brown) in the plaque. The identity of the macrophages was additionally confirmed using an antibody against the pan macrophage F4/80 marker (Pharmingen).
FIGURE 2.
MMP-25 is uniquely enriched in the bone marrow. Heat map and the hierarchical bi-clustering of the expression data (log10 of expression level) of MMPs and their natural inhibitors TIMPs and RECK (Vertical clustering, by the level of expression in the individual tissue types. Right, horizontal clustering, by gene expression levels, on the top). The data were derived from 356 gene arrays of 65 normal tissue types. Red and green correspond to the high and the low expression levels, respectively. Black represents an average level of expression. Color map inset shows the distribution (frequency) of different gene expression levels in the set and related colors. Arrow points to MMP-25 in the bone marrow.
FIGURE 3.
MMP proteolysis of MBP and activation of the specific T cell clone. A, 1–171-residue sequence of human MBP (GenBankTM accession number AAH08749). The immunogenic regions are shown at the bottom of the panel using the MBP residue numbering. Following the MBP cleavage by MMPs, the mass and, consecutively, the sequence of the digest fragments were determined by MALDI-TOF MS. The italicized numbers indicate the positions of the cleavage sites. B, MMP-25 proteolysis of MBP, BG21, and J37. Where indicated, an inhibitor (GM6001) was added to the reactions. C, MMPs cleave MBP and generate the N-terminal peptide that stimulates the proliferation of the specific T cell clone. MBP (5 μ
m
) was cleaved by the indicated MMPs (an enzyme/substrate molar ratio of 1:100). The irradiated splenocytes from B10.PL mice were incubated with the cleavage reactions. The PGPR7.5 T cells specific for the murine 1–15-residue MBP peptide and [3H]thymidine were then added to the reactions. The incorporation of the label into the T cells was measured by liquid scintillation counting. For MBP alone, intact MBP (5 μ
m
) was added to the cells. For cells alone, no peptide was added. For peptide, the 1–15-residue ASQKRPSQRSKYLATAS MBP peptide (5 μ
m
) was used as a control (= 100%). The numbers show the percentage relative to the peptide control. The experiments were repeated four times, and the data represent the mean ± S.E.
FIGURE 4.
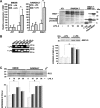
LPS stimulates the proteolytic pathway in the macrophages. A, LPS up-regulates BG21 in the macrophages. Left, BMDM and RAW264.7 macrophage cells were left intact or treated 24 h with LPS. Total RNA extracted from the cells was analyzed by Q-RT-PCR to determine the levels of the BG21 and J37 mRNAs. Right, murine breast carcinoma 4T1 and macrophage RAW264.7 cells were treated with LPS for the indicated time. The cell lysate samples (50 μg of total protein) were analyzed by Western blotting with the Golli-MBP antibody. The three right lanes show the in vitro cleavage of BG21 by MMP-25 at a 1:100–1:1000 enzyme/substrate molar ratio and intact BG21. The experiments were repeated 3–5 times, and the data represent the mean ± S.E. *, p < 0.05. B, LPS up-regulates MMP-25 in the macrophages. Left, RAW264.7 cells were left intact (−LPS) or treated 24 h with LPS (+LPS). Total RNA extracted from the cells was analyzed by RT-PCR to determine the levels of the mRNAs of the individual MMPs. GAPDH was used as a control. The calculated size of the amplified fragments was 278, 343, 297, 285, 299, and 300 bp for MMP-2, -9, -12, -14, -25, and GAPDH, respectively. Right, two independent RAW264.7 cell samples were left intact or treated 24 h with LPS. The cell lysate samples (50 μg of total protein) were analyzed by Western blotting with the MMP-25 antibody (top panel). The images were scanned and digitized using the Fujifilm MultiGauge software. The MMP-25 band density (bottom panel) is shown in arbitrary units (AU). These experiments were repeated 3–5 times with comparable results. *, p < 0.05. C, LPS up-regulates PC2 in the macrophages. BMDM and RAW264.7 cells were left intact or treated with LPS for 18–36 h. The cell lysate samples (50 μg of total protein) were analyzed by Western blotting with the PC2 antibody (top panel). Murine mammary carcinoma 4T1 cells (4T1), which do not produce any significant level of PC2, were used as a negative control. The images were scanned and digitized using the Fujifilm MultiGauge software. The PC2 band density (bottom panel) is shown in arbitrary units (AU). These experiments were repeated 3–5 times with comparable results. *, p < 0.05.
FIGURE 5.
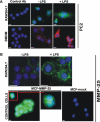
Immunostaining of PC2 and MMP-25. A, macrophage RAW264.7 cells and the murine BMDM were grown in the LabTek chamber slides. The cells were left intact (−LPS) or stimulated 24 h with LPS (1 μg/ml). The cells were fixed, permeabilized, and stained with the PC2 antibody (Ab) followed by the secondary antibody conjugated with Alexa Fluor 488 (green) or Alexa Fluor 594 (red). Staining with the preimmune rabbit serum (control antibody) was negative. The nuclei were stained with 4′,6-diamidino-2-phenylindole (blue). B, macrophage RAW264.7 cells were grown in the LabTek chamber slides. The cells were left intact (−LPS) or stimulated 24 h with LPS (1 μg/ml). The cells were fixed and stained with the MMP-25 antibody. Breast carcinoma MCF7 cells stably transfected with MMP-25 (MCF-MMP-25) or the empty plasmid (MCF-mock) were used as controls. Inset, cell surface staining of MMP-25. The nuclei were stained with 4′,6-diamidino-2-phenylindole (blue). Original magnification ×400; the bar, 10 μm.
FIGURE 6.
MS analysis of the VRRRRRYALS peptide cleavage. The VRRRRRYALS peptide that spans the furin cleavage site in the propeptide of human MMP-25 was incubated for 2 h at 37 °C with furin and PC2 (1 activity unit each). The mass of the cleavage peptides was determined using MALDI-TOF MS. There was no difference between the calculated and the estimated molecular mass of the peptides. Where indicated, the PC inhibitor (dec-RVKR-cmk) was added to the reactions. The mass of the intact peptide was 1332 Da (underlined). The mass of the VRRRRR cleavage product was 898 Da.
FIGURE 7.
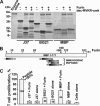
Furin proteolysis of MBP and activation of the specific T cell clone. A, furin proteolysis of the MBP isoforms. MBP, J37, and BG21 were incubated for 3 h at 37 °C with furin at an enzyme/substrate molar ratio of 1:4. The digest reactions were analyzed by SDS-gel electrophoresis followed by Coomassie staining. Where indicated, dec-RVKR-cmk was added to the reactions. B, 1–171-residue sequence of human MBP (GenBankTM accession number AAH08749). The immunogenic regions are shown at the bottom of the panel using the MBP residue numbering. Following the MBP cleavage by MMPs, the mass and, consecutively, the sequence of the digest fragments was determined by MALDI-TOF MS. The italicized numbers indicate the positions of the cleavage sites. C, furin proteolysis of MBP generates the N-terminal peptide that stimulates the proliferation of the specific T cell clone. MBP, BG21, and J37 (5 μ
m
each) were co-incubated for 3 h at 37 °C with furin at an enzyme/substrate molar ratio of 1:4. The irradiated splenocytes from B10.PL mice were incubated with the cleavage reactions. The PGPR7.5 T cells specific for the murine MBP-(1–15)-peptide and [3H]thymidine were then added to the reactions. The incorporation of the label into the T cells was measured by liquid scintillation counting. MBP, BG21, and J37 alone indicate intact MBP, BG21, and J37 (5 μ
m
each) added to the cells. Cells alone indicates no peptide. Peptide, the 1–15-residue ASQKRPSQRSKYLATAS MBP peptide (5 μ
m
) was used as a control (= 100%). The numbers show the percentage relative to the peptide control. The experiments were performed in triplicate and repeated twice. The data represent the mean ± S.E.
FIGURE 8.
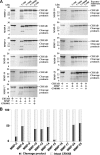
Multiple MMPs cleave CRYAB. A, purified 1–175 human crystallin αB was co-incubated with the individual MMPs at the indicated enzyme/substrate molar ratio. Where indicated, an inhibitor (GM6001) was added to the reactions. B, quantification of MMP proteolysis of CRYAB. The images shown in A were scanned and digitized. The ratios of the intact CRYAB (27–28 kDa) to the major digest product (25–26 kDa) are shown for the individual MMPs (the 1:1000 enzyme/substrate ratio except the 1:100 ratio which was used to calculate the data with MMP-24). The experiments were repeated 4–5 times with comparable results. The data from one representative experiment are shown.
FIGURE 9.
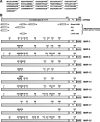
MMPs proteolysis of CRYAB generates the immunogenic fragments. A, 1–175-residue sequence of the human crystallin αB construct tagged with the V5 and His6 tags. B, schematic representation of the CRYAB construct and MMP proteolysis. The immunogenic regions are shown at the bottom of the panel. The immunogenicity of these regions was detected using Biozzi ABH, SJL, and 129 mice and Lewis rats (47, 48). Following the CRYAB cleavage by MMPs, the mass and, consecutively, the sequence of the digest fragments were determined by MALDI-TOF MS. The numbers indicate the positions of the cleavage sites.
FIGURE 10.
Inflammatory proteolytic pathway to MS. Phase 1, persistent inflammation caused by viral and bacterial infections and other related factors up-regulates PCs (furin and PC2), MMP-25, and BG21 (up arrows) in the stimulated antigen-presenting macrophages. Autoactivated PCs activate MMP-25, which then cleaves BG21 (the down arrows). The immunogenic fragments of the MBP portion of BG21 are presented in the major histocompatibility complex on the cell surface leading to the activation of the specific populations of the autoimmune T cells. Phase 2, if the brain barrier is not intact, the activated T cells home to the brain, attack the neuronal MBP, and cause inflammation leading to the macrophage infiltration and the follow-up up-regulation of the activity of multiple MMP types, many of which contribute to the further destruction of MBP and to the local demyelination causing plaque formation.
Similar articles
- Biochemical characterization of the cellular glycosylphosphatidylinositol-linked membrane type-6 matrix metalloproteinase.
Radichev IA, Remacle AG, Shiryaev SA, Purves AN, Johnson SL, Pellecchia M, Strongin AY. Radichev IA, et al. J Biol Chem. 2010 May 21;285(21):16076-86. doi: 10.1074/jbc.M110.107094. Epub 2010 Mar 22. J Biol Chem. 2010. PMID: 20308072 Free PMC article. - Matrix metalloproteinase proteolysis of the myelin basic protein isoforms is a source of immunogenic peptides in autoimmune multiple sclerosis.
Shiryaev SA, Savinov AY, Cieplak P, Ratnikov BI, Motamedchaboki K, Smith JW, Strongin AY. Shiryaev SA, et al. PLoS One. 2009;4(3):e4952. doi: 10.1371/journal.pone.0004952. Epub 2009 Mar 20. PLoS One. 2009. PMID: 19300513 Free PMC article. - Myelin basic protein induces inflammatory mediators from primary human endothelial cells and blood-brain barrier disruption: implications for the pathogenesis of multiple sclerosis.
D'Aversa TG, Eugenin EA, Lopez L, Berman JW. D'Aversa TG, et al. Neuropathol Appl Neurobiol. 2013 Apr;39(3):270-83. doi: 10.1111/j.1365-2990.2012.01279.x. Neuropathol Appl Neurobiol. 2013. PMID: 22524708 Free PMC article. - The significance of matrix metalloproteinases in the immunopathogenesis and treatment of multiple sclerosis.
Mirshafiey A, Asghari B, Ghalamfarsa G, Jadidi-Niaragh F, Azizi G. Mirshafiey A, et al. Sultan Qaboos Univ Med J. 2014 Feb;14(1):e13-25. doi: 10.12816/0003332. Epub 2014 Jan 27. Sultan Qaboos Univ Med J. 2014. PMID: 24516744 Free PMC article. Review. - MyelStones: the executive roles of myelin basic protein in myelin assembly and destabilization in multiple sclerosis.
Vassall KA, Bamm VV, Harauz G. Vassall KA, et al. Biochem J. 2015 Nov 15;472(1):17-32. doi: 10.1042/BJ20150710. Biochem J. 2015. PMID: 26518750 Review.
Cited by
- Novel MT1-MMP small-molecule inhibitors based on insights into hemopexin domain function in tumor growth.
Remacle AG, Golubkov VS, Shiryaev SA, Dahl R, Stebbins JL, Chernov AV, Cheltsov AV, Pellecchia M, Strongin AY. Remacle AG, et al. Cancer Res. 2012 May 1;72(9):2339-49. doi: 10.1158/0008-5472.CAN-11-4149. Epub 2012 Mar 9. Cancer Res. 2012. PMID: 22406620 Free PMC article. - Biochemical characterization of the cellular glycosylphosphatidylinositol-linked membrane type-6 matrix metalloproteinase.
Radichev IA, Remacle AG, Shiryaev SA, Purves AN, Johnson SL, Pellecchia M, Strongin AY. Radichev IA, et al. J Biol Chem. 2010 May 21;285(21):16076-86. doi: 10.1074/jbc.M110.107094. Epub 2010 Mar 22. J Biol Chem. 2010. PMID: 20308072 Free PMC article. - A sensitive and selective ELISA methodology quantifies a demyelination marker in experimental and clinical samples.
Remacle AG, Dolkas J, Angert M, Hullugundi SK, Chernov AV, Jones RCW 3rd, Shubayev VI, Strongin AY. Remacle AG, et al. J Immunol Methods. 2018 Apr;455:80-87. doi: 10.1016/j.jim.2018.02.002. Epub 2018 Feb 8. J Immunol Methods. 2018. PMID: 29428829 Free PMC article. - Predictive models of protease specificity based on quantitative protease-activity profiling data.
Fedonin GG, Eroshkin A, Cieplak P, Matveev EV, Ponomarev GV, Gelfand MS, Ratnikov BI, Kazanov MD. Fedonin GG, et al. Biochim Biophys Acta Proteins Proteom. 2019 Nov;1867(11):140253. doi: 10.1016/j.bbapap.2019.07.006. Epub 2019 Jul 19. Biochim Biophys Acta Proteins Proteom. 2019. PMID: 31330204 Free PMC article. - Function of microglia and macrophages in secondary damage after spinal cord injury.
Zhou X, He X, Ren Y. Zhou X, et al. Neural Regen Res. 2014 Oct 15;9(20):1787-95. doi: 10.4103/1673-5374.143423. Neural Regen Res. 2014. PMID: 25422640 Free PMC article. Review.
References
- Steinman L. (2001) Nat. Immunol. 2, 762–764 - PubMed
- Fugger L., Friese M. A., Bell J. I. (2009) Nat. Rev. Immunol., in press - PubMed
- Hellings N., Barée M., Verhoeven C., D'hooghe M. B., Medaer R., Bernard C. C., Raus J., Stinissen P. (2001) J. Neurosci. Res. 63, 290–302 - PubMed
- Weaver A., Goncalves da Silva A., Nuttall R. K., Edwards D. R., Shapiro S. D., Rivest S., Yong V. W. (2005) FASEB J. 19, 1668–1670 - PubMed
Publication types
MeSH terms
Substances
Grants and funding
- R01 CA077470/CA/NCI NIH HHS/United States
- R01 CA083017/CA/NCI NIH HHS/United States
- CA83017/CA/NCI NIH HHS/United States
- RR020843/RR/NCRR NIH HHS/United States
- CA77470/CA/NCI NIH HHS/United States
- U54 RR020843/RR/NCRR NIH HHS/United States
LinkOut - more resources
Full Text Sources
Other Literature Sources
Medical
Miscellaneous


