Suppression of long chain acyl-CoA synthetase 3 decreases hepatic de novo fatty acid synthesis through decreased transcriptional activity - PubMed (original) (raw)
Suppression of long chain acyl-CoA synthetase 3 decreases hepatic de novo fatty acid synthesis through decreased transcriptional activity
So Young Bu et al. J Biol Chem. 2009.
Abstract
Long chain acyl-CoA synthetases (ACSL) and fatty acid transport proteins (FATP) activate fatty acids to acyl-CoAs in the initial step of fatty acid metabolism. Numerous isoforms of ACSL and FATP exist with different tissue distribution patterns, intracellular locations, and substrate preferences, suggesting that each isoform has distinct functions in channeling fatty acids into different metabolic pathways. Because fatty acids, acyl-CoAs, and downstream lipid metabolites regulate various transcription factors that control hepatic energy metabolism, we hypothesized that ACSL or FATP isoforms differentially regulate hepatic gene expression. Using small interference RNA (siRNA), we knocked down each liver-specific ACSL and FATP isoform in rat primary hepatocyte cultures and subsequently analyzed reporter gene activity of numerous transcription factors and performed quantitative mRNA analysis of their target genes. Compared with control cells, which were transfected with control siRNA, knockdown of acyl-CoA synthetase 3 (ACSL3) significantly decreased reporter gene activity of several lipogenic transcription factors such as peroxisome proliferator activation receptor-gamma, carbohydrate-responsive element-binding protein, sterol regulatory element-binding protein-1c, and liver X receptor-alpha and the expression of their target genes. These findings were further supported by metabolic labeling studies that showed [1-(14)C]acetate incorporation into lipid extracts was decreased in cells treated with ACSL3 siRNAs and that ACSL3 expression is up-regulated in ob/ob mice and mice fed a high sucrose diet. ACSL3 knockdown decreased total acyl-CoA synthetase activity without substantially altering the expression of other ACSL isoforms. In summary, these results identify a novel role for ACSL3 in mediating transcriptional control of hepatic lipogenesis.
Figures
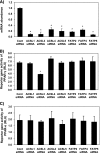
FIGURE 1.
Knockdown of ACSL and FATP isoforms and their effects on transcriptional activity of PPAR-γ in rat primary hepatocytes. Hepatocytes were plated at 0.5 × 10⁶ cells/22 mm well and transfected with 1 μg of siRNA targeting ACSL1, ACSL3, ACSL4, ACSL5, FATP2, FATP4, or FATP5 per well. A, abundance of mRNA for each ACSL or FATP isoform was quantified 24 h after transfection using quantitative RT-PCR and normalized to RPL-32. B and C, pSG5-GAL4-hPPAR-γ (B) or pSG5-GAL4-hPPAR-α (C) expression plasmids were co-transfected with TK-MH-UAS-Luc reporter plasmids, and 50 h later cells were lysed for reporter gene assays. Values shown are mean ± S.E. from a representative experiment performed in triplicate that was repeated two or three times. Data are expressed relative to the cells transfected with nonspecific targeting siRNA (Cont). *, p < 0.05, when compared with controls.
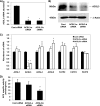
FIGURE 2.
ACSL3 siRNAs suppress ACSL3 expression and cellular acyl-CoA synthetase activity. A, abundance of mRNA for ACSL3 was quantified 24 h after transfection using quantitative RT-PCR and normalized to RPL-32. B, proteins were harvested at 50 h after transfection and were subjected to Western blotting; expression of β-actin was used as a loading control. C, quantitative RT-PCR analysis of mRNA abundance for ACSL and FATP isoforms at 50 h after transfection. D, at 50 h after transfection, cells were harvested in cold Med-I buffer, and acyl-CoA synthetase activity was determined. Values shown are mean ± S.E. from a representative experiment performed in triplicate that was repeated two or three times and indicated relative to nonspecific target control (Cont). *, p < 0.05, when compared with controls.
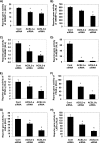
FIGURE 3.
Knockdown of ACSL3 suppresses the activity of lipogenic transcription factors in rat primary hepatocytes. ACSL3-a or ACSL3-b siRNA were transfected in rat primary hepatocytes, and reporter gene activities were quantified after 50 h. A and B, for SREBP, firefly luciferase reporter of SRE sequence on FAS gene were transfected for reporter gene assay. Cells in B were also transfected with pCMV-SREBP1-c, a constitutively active form of SREBP. C and D, firefly luciferase reporter driven by the ACC carbohydrate response element-containing promoter region was transfected for measurement of ChREBP in cells treated with 5 m
m
(C) and 25 m
m
glucose (D). E and F, pSG5-GAL4-hPPAR-γ expression plasmids were co-transfected with TK-MH-UAS-Luc reporter plasmids in cells treated with DMSO (E) or 10 μ
m
rosiglitazone (F) for 18 h to determine whether synthetic ligands normalize PPAR-γ. G and H, pCMX-hLXR-α expression plasmid and TK-hcyp7a-LXRE(X3)-Luc reporter plasmid were used for measurement of LXR-α activity in cells treated with DMSO (G) or 15 μ
m
T0901317 (H) for 18 h. Values shown are mean ± S.E. from a representative experiment performed in triplicate that was repeated two or three times. *, p < 0.05 when compared with controls.
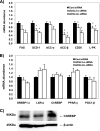
FIGURE 4.
ACSL3 knockdown decreases lipogenic gene expression. Rat primary hepatocytes were plated at 0.5 × 10⁶ cells/22-mm well and transfected with 1 μg of siRNA per well. After 50 h of siRNA transfection, total RNA was isolated and mRNA expression of lipogenic genes (A) or transcription factors and co-activators (B) were quantified using quantitative RT-PCR and normalized to RPL-32. C, proteins were harvested at 50 h after transfection and subjected to Western blotting for measurement of ChREBP. From left to right, the lanes represent control, ACSL3-a, and ACSL3-b siRNA, respectively. Values are reported as mean ± S.E. in duplicate from four individual experiments performed and indicated relative to the cells transfected with control siRNA. *, p < 0.05 when compared with controls.
FIGURE 5.
Knockdown of ACSL3 suppresses de novo lipogenesis. At 72 h after transfection, cells were labeled with 1 μCi of [1-14C]acetic acid per 0.5 × 10⁶ cells for 3 h (A and B) and 15 min (C and D). Lipids were extracted from the cells and quantified as described under “Experimental Procedures.” Data are indicated as mean ± S.E. from a representative experiment performed in triplicate that was repeated three times. *, p < 0.05 when compared with controls.
FIGURE 6.
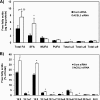
Composition of total cellular free fatty acids. At 50 h after transfection of siRNAs, lipids were extracted from the cells and free fatty acids were separated by TLC. Methyl esters of fatty acids were quantified by gas chromatography. A, sum of free fatty acids and fatty acid classes was calculated. Amount of total free fatty acids in control siRNA-transfected cells was 4.1 μg/mg of protein. B, composition of each different species of free fatty acids. SFA, saturated fatty acids; MUFA, monounsaturated fatty acids; and PUFA, polyunsaturated fatty acids. Data represent triplicate samples. Data are indicated as mean ± S.E. *, p < 0.05 when compared with controls.
FIGURE 7.
ACSL3 siRNA-mediated knockdown does not alter the phosphorylation of AMPK. Total proteins were harvested at 50 h after transfection of siRNAs and were subjected to Western blotting for measuring expression of AMPK and phosphorylated AMPK at Thr-172.
FIGURE 8.
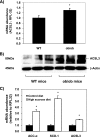
Expression of ACSL3 is up-regulated in ob/ob mice and C57/BL6 mice fed a high sucrose diet. A and B, expression of ACSL3 was compared in liver tissue of 5-week-old male ob/ob (n = 5) and lean wild-type (WT) C57/BL6 mice (n = 4) fed chow diets. A, total RNA was extracted, and the abundance of mRNA for ACSL3 was quantified using quantitative RT-PCR and normalized to RPL-32. *, p < 0.05 when compared with WT mice. B, total proteins were subjected to Western blot, and expression of β-actin was analyzed as an internal control. C, expression of ACSL3 was compared in liver tissue of 5-week-old male C57/BL6 mice (n = 4 per group) fed AIN-93 diet (control diet) or high sucrose (45%) diet for 1 week. Values are reported as mean ± S.E. and are expressed relative to the mice fed the control diet. *, p < 0.05 when compared with control diet.
Similar articles
- Hepatic long-chain acyl-CoA synthetase 5 mediates fatty acid channeling between anabolic and catabolic pathways.
Bu SY, Mashek DG. Bu SY, et al. J Lipid Res. 2010 Nov;51(11):3270-80. doi: 10.1194/jlr.M009407. Epub 2010 Aug 26. J Lipid Res. 2010. PMID: 20798351 Free PMC article. - Distinct transcriptional regulation of long-chain acyl-CoA synthetase isoforms and cytosolic thioesterase 1 in the rodent heart by fatty acids and insulin.
Durgan DJ, Smith JK, Hotze MA, Egbejimi O, Cuthbert KD, Zaha VG, Dyck JR, Abel ED, Young ME. Durgan DJ, et al. Am J Physiol Heart Circ Physiol. 2006 Jun;290(6):H2480-97. doi: 10.1152/ajpheart.01344.2005. Epub 2006 Jan 20. Am J Physiol Heart Circ Physiol. 2006. PMID: 16428347 - Ontogeny of mRNA expression and activity of long-chain acyl-CoA synthetase (ACSL) isoforms in Mus musculus heart.
de Jong H, Neal AC, Coleman RA, Lewin TM. de Jong H, et al. Biochim Biophys Acta. 2007 Jan;1771(1):75-82. doi: 10.1016/j.bbalip.2006.11.007. Epub 2006 Nov 30. Biochim Biophys Acta. 2007. PMID: 17197235 Free PMC article. - Long-chain acyl-CoA synthetase in fatty acid metabolism involved in liver and other diseases: an update.
Yan S, Yang XF, Liu HL, Fu N, Ouyang Y, Qing K. Yan S, et al. World J Gastroenterol. 2015 Mar 28;21(12):3492-8. doi: 10.3748/wjg.v21.i12.3492. World J Gastroenterol. 2015. PMID: 25834313 Free PMC article. Review. - Peroxisomal beta-oxidation and peroxisome proliferator-activated receptor alpha: an adaptive metabolic system.
Reddy JK, Hashimoto T. Reddy JK, et al. Annu Rev Nutr. 2001;21:193-230. doi: 10.1146/annurev.nutr.21.1.193. Annu Rev Nutr. 2001. PMID: 11375435 Review.
Cited by
- Integrated Regulation of Hepatic Lipid and Glucose Metabolism by Adipose Triacylglycerol Lipase and FoxO Proteins.
Zhang W, Bu SY, Mashek MT, O-Sullivan I, Sibai Z, Khan SA, Ilkayeva O, Newgard CB, Mashek DG, Unterman TG. Zhang W, et al. Cell Rep. 2016 Apr 12;15(2):349-59. doi: 10.1016/j.celrep.2016.03.021. Epub 2016 Mar 31. Cell Rep. 2016. PMID: 27050511 Free PMC article. - Pinolenic Acid Downregulates Lipid Anabolic Pathway in HepG2 Cells.
Lee AR, Han SN. Lee AR, et al. Lipids. 2016 Jul;51(7):847-55. doi: 10.1007/s11745-016-4149-6. Epub 2016 Apr 15. Lipids. 2016. PMID: 27084371 - Targeted overexpression of inducible 6-phosphofructo-2-kinase in adipose tissue increases fat deposition but protects against diet-induced insulin resistance and inflammatory responses.
Huo Y, Guo X, Li H, Xu H, Halim V, Zhang W, Wang H, Fan YY, Ong KT, Woo SL, Chapkin RS, Mashek DG, Chen Y, Dong H, Lu F, Wei L, Wu C. Huo Y, et al. J Biol Chem. 2012 Jun 15;287(25):21492-500. doi: 10.1074/jbc.M112.370379. Epub 2012 May 3. J Biol Chem. 2012. PMID: 22556414 Free PMC article. - Signature molecules expressed differentially in a liver disease stage-specific manner by HIV-1 and HCV co-infection.
Whitmill A, Kim S, Rojas V, Gulraiz F, Afreen K, Jain M, Singh M, Park IW. Whitmill A, et al. PLoS One. 2018 Aug 23;13(8):e0202524. doi: 10.1371/journal.pone.0202524. eCollection 2018. PLoS One. 2018. PMID: 30138348 Free PMC article. - Acyl-coenzyme A synthetases in metabolic control.
Ellis JM, Frahm JL, Li LO, Coleman RA. Ellis JM, et al. Curr Opin Lipidol. 2010 Jun;21(3):212-7. doi: 10.1097/mol.0b013e32833884bb. Curr Opin Lipidol. 2010. PMID: 20480548 Free PMC article. Review.
References
- Jump D. B., Botolin D., Wang Y., Xu J., Christian B., Demeure O. (2005) J. Nutr. 135, 2503–2506 - PubMed
- Zhang Y. L., Hernandez-Ono A., Siri P., Weisberg S., Conlon D., Graham M. J., Crooke R. M., Huang L. S., Ginsberg H. N. (2006) J. Biol. Chem. 281, 37603–37615 - PubMed
- Pawar A., Xu J., Jerks E., Mangelsdorf D. J., Jump D. B. (2002) J. Biol. Chem. 277, 39243–39250 - PubMed
- Xu J., Teran-Garcia M., Park J. H., Nakamura M. T., Clarke S. D. (2001) J. Biol. Chem. 276, 9800–9807 - PubMed
Publication types
MeSH terms
Substances
LinkOut - more resources
Full Text Sources
Molecular Biology Databases
Miscellaneous
