Identification and characterization of the interferon-beta-mediated p53 signal pathway in human peripheral blood mononuclear cells - PubMed (original) (raw)
Identification and characterization of the interferon-beta-mediated p53 signal pathway in human peripheral blood mononuclear cells
Fanglin Zhang et al. Immunology. 2009 Sep.
Abstract
The relationship between the p53 signal pathway and the response of human peripheral blood mononuclear cells (PBMC) to interferon (IFN)-beta has hitherto not been examined. Using an oligonucleotide microarray, we found differential expression of at least 70 genes involved in the p53 signal pathway, including p53, which regulate cell proliferation and cell death following stimulation with IFN-beta. We verified our observations on a limited set of p53-regulated genes at the transcriptional and translational levels. We also examined the consequences of the activation of the p53 signal pathway by IFN-beta in PBMC. When cultured in the presence of T-cell mitogens, IFN-beta restricted the entry of lymphocytes from the G0/G1 phase to the S phase and reduced the number of cells in the G2 phase. The addition of IFN-beta alone did not increase apoptosis. However, in the presence of actinomycin D, a DNA-damaging agent, addition of IFN-beta enhanced the susceptibility of PBMC to apoptosis. These observations suggest that, in spite of the activation of a number of mutually overlapping pathways mediating cell death, cell cycle arrest was the most evident consequence of IFN-beta signalling in PBMC.
Figures
Figure 1
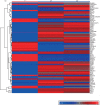
Activation of the p53 signal pathway by interferon (IFN)-β in peripheral blood mononuclear cells (PBMC) at the transcription level. (a) Hierarchical cluster of 74 differentially regulated genes in the p53 signal pathway after culture of PBMC with IFN-β. Each row corresponds to a single gene and each column corresponds to the average relative expression level at each time-point, with 0, 24 and 48 hr from left to right. The values were transformed to a log2 scale and converted into colour intensity. Red indicates increased expression and blue indicates reduced expression. (b–g) Real-time reverse transcription–polymerase chain reaction (RT-PCR) values for p53 and its target genes following culture with IFN-β: (b) p53, (c) Bcl-2-associated X protein (Bax), (d) NOXA, (e) PUMA, (f) p21 and (g) MDM2; pooled data from seven individuals. The _y_-axis represents the fold increase in real-time values after normalization to β-actin. **P < 0·001; *P < 0·05 when compared with unstimulated cells at 0 hr.
Figure 2
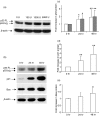
(a) Western blots showing the dose–response of p53 expression in response to interferon (IFN)-β at 48 hr, (b) western blots showing the induction of p53, p21 and Bcl-2-associated X protein (Bax) in peripheral blood mononuclear cells (PBMC) cultured with 1000 IU/ml IFN-β, (c–e) densitometric values of western blots of (c) p53, (d) p21 and (e) Bax, for 12 individuals, normalized to β-actin. **P < 0·001; *P < 0·05 when compared with unstimulated cells at 0 hr.
Figure 3
Induction of p53 in peripheral blood mononuclear cells (PBMC) following gamma irradiation (IR) or after culture with interferon (IFN)-β. (a) Induction of p53 in PBMC from three individuals following culture with IFN-β (1000 IU/ml for 48 hr) and probing with anti-p53 antibody. (b) Densitometric analysis of p53 after normalization to β-actin. (c) Induction of p53 in PBMC from the same three individuals following gamma irradiation of PBMCs (10 Gy). (d) Densitometric analysis of p53 and its isomers, after normalization to β-actin. The _y_-axis in (b) and (d) represents the per cent increase in the signal of the full-length (FL) and beta/gamma (b/g) isoforms in cells subjected to either gamma irradiation or culture with IFN-β when compared with cells cultured in medium alone.
Figure 4
Induction of signal transducers and activators of transcription 1 (STAT1) and STAT2 by interferon (IFN)-β. (a) Western blots of STAT1 and STAT2 proteins following culture of peripheral blood mononuclear cells (PBMC) with IFN-β from two individuals. (b) Densitometric values of protein levels for STAT1 and (c) densitometric values for STAT 2; pooled analysis for 12 individuals. (d, e) Results of real-time reverse transcription–polymerase chain reaction (RT-PCR) for (d) STAT1 and (e) STAT2 gene expression following culture of PBMC with IFN-β; pooled analysis for seven individuals. Results are expressed as fold increase in mRNA levels over that seen following culture of PBMC in medium alone. *P < 0·05; **P < 0·001 when compared with cells at 0 hr.
Figure 5
Flow cytometric analysis of induction of apoptosis by interferon (IFN)-β: (a) cells treated with medium alone, (b) cells treated with 1000 IU/ml IFN-β for 48 hr, (c) cells treated with actinomycin D (50 ng/ml) for 24 hr, and (d) cells treated with IFN-β for 48 hr with actinomycin D added for the last 24 hr of culture. (e) Bar graph representing the apoptosis of peripheral blood mononuclear cells (PBMC) following culture with IFN-β in the presence or absence of actinomycin D. Data are representative of seven independent experiments. *P < 0·05; **P < 0·001 when compared with cells that were cultured with medium alone; Δ_P_ < 0·05 compared with cultured with actinomycin D alone.
Figure 6
Flow cytometric analysis of cell cycle dynamics of CD3+ T lymphocytes stimulated with phytohaemagglutinin (PHA) in the presence or absence of interferon (IFN)-β: (a) control, cells cultured in medium alone; (b) cells cultured with IFN-β for 48 hr; (c) cells cultured with PHA for 48 hr and (d) cells cultured with IFN-β and PHA for 48 hr. The figure shows the profile for one representative from six individuals. Regulation of cell cycle progression by IFN-β: (e) G0/G1 phase, (f) S phase and (g) G2 phase. Error bars represent the mean and standard deviation of values for six individuals. *P < 0·05 for the comparison between cells cultured with PHA alone and cells cultured with PHA plus IFN-β.
Similar articles
- Rescue by cytokines of apoptotic cell death induced by IL-2 deprivation of human antigen-specific T cell clones.
Kaneko S, Suzuki N, Koizumi H, Yamamoto S, Sakane T. Kaneko S, et al. Clin Exp Immunol. 1997 Jul;109(1):185-93. doi: 10.1046/j.1365-2249.1997.4191324.x. Clin Exp Immunol. 1997. PMID: 9218843 Free PMC article. - The Study of Immune Response in PBMC of CHB Patients treated with IFN-α and 3-TC in vitro.
Zhang H, Guan ZS, Guan SH, Yang K, Pan Y, Wu YY, Wang AH, Sun BB, Hou J, Mu XX, Gao YF, Cheng WS. Zhang H, et al. Clin Lab. 2016 Dec 1;62(12):2313-2318. doi: 10.7754/Clin.Lab.2016.160318. Clin Lab. 2016. PMID: 28164560 - Type I interferon-regulated gene expression and signaling in murine mixed glial cells lacking signal transducers and activators of transcription 1 or 2 or interferon regulatory factor 9.
Li W, Hofer MJ, Songkhunawej P, Jung SR, Hancock D, Denyer G, Campbell IL. Li W, et al. J Biol Chem. 2017 Apr 7;292(14):5845-5859. doi: 10.1074/jbc.M116.756510. Epub 2017 Feb 17. J Biol Chem. 2017. PMID: 28213522 Free PMC article. - Stat1 and Stat2 but not Stat3 arbitrate contradictory growth signals elicited by alpha/beta interferon in T lymphocytes.
Gimeno R, Lee CK, Schindler C, Levy DE. Gimeno R, et al. Mol Cell Biol. 2005 Jul;25(13):5456-65. doi: 10.1128/MCB.25.13.5456-5465.2005. Mol Cell Biol. 2005. PMID: 15964802 Free PMC article.
Cited by
- Baseline gene expression signatures in monocytes from multiple sclerosis patients treated with interferon-beta.
Bustamante MF, Nurtdinov RN, Río J, Montalban X, Comabella M. Bustamante MF, et al. PLoS One. 2013 Apr 18;8(4):e60994. doi: 10.1371/journal.pone.0060994. Print 2013. PLoS One. 2013. PMID: 23637780 Free PMC article. - C/EBPβ deletion in oncogenic Ras skin tumors is a synthetic lethal event.
Messenger ZJ, Hall JR, Jima DD, House JS, Tam HW, Tokarz DA, Smart RC. Messenger ZJ, et al. Cell Death Dis. 2018 Oct 15;9(11):1054. doi: 10.1038/s41419-018-1103-y. Cell Death Dis. 2018. PMID: 30323292 Free PMC article. - Mathematical model of STAT signalling pathways in cancer development and optimal control approaches.
Lee J, Lee D, Kim Y. Lee J, et al. R Soc Open Sci. 2021 Sep 29;8(9):210594. doi: 10.1098/rsos.210594. eCollection 2021 Sep. R Soc Open Sci. 2021. PMID: 34631119 Free PMC article. - p53 Isoforms as Cancer Biomarkers and Therapeutic Targets.
Zhao L, Sanyal S. Zhao L, et al. Cancers (Basel). 2022 Jun 27;14(13):3145. doi: 10.3390/cancers14133145. Cancers (Basel). 2022. PMID: 35804915 Free PMC article. Review. - Role of HDAC3 on p53 expression and apoptosis in T cells of patients with multiple sclerosis.
Zhang F, Shi Y, Wang L, Sriram S. Zhang F, et al. PLoS One. 2011 Feb 8;6(2):e16795. doi: 10.1371/journal.pone.0016795. PLoS One. 2011. PMID: 21346816 Free PMC article.
References
- de Weerd NA, Samarajiwa SA, Hertzog PJ. Type I interferon receptors: biochemistry and biological functions. J Biol Chem. 2007;282:20053–7. - PubMed
- Pestka S. The interferons: 50 years after their discovery, there is much more to learn. J Biol Chem. 2007;282:20047–51. - PubMed
- Takaoka A, Yanai H. Interferon signalling network in innate defence. Cell Microbiol. 2006;8:907–22. - PubMed
- Uze G, Schreiber G, Piehler J, Pellegrini S. The receptor of the type I interferon family. Curr Top Microbiol Immunol. 2007;316:71–95. - PubMed
- Darnell JE, Jr, Kerr IM, Stark GR. Jak-STAT pathways and transcriptional activation in response to IFNs and other extracellular signaling proteins. Science. 1994;264:1415–21. - PubMed
Publication types
MeSH terms
Substances
LinkOut - more resources
Full Text Sources
Research Materials
Miscellaneous


