Intact long-term potentiation but reduced connectivity between neocortical layer 5 pyramidal neurons in a mouse model of Rett syndrome - PubMed (original) (raw)
Comparative Study
Intact long-term potentiation but reduced connectivity between neocortical layer 5 pyramidal neurons in a mouse model of Rett syndrome
Vardhan S Dani et al. J Neurosci. 2009.
Abstract
Mutations in MECP2 cause Rett syndrome and some related forms of mental retardation and autism. Mecp2-null mice exhibit symptoms reminiscent of Rett syndrome including deficits in learning. Previous reports demonstrated impaired long-term potentiation (LTP) in slices of symptomatic Mecp2-null mice, and decreased excitatory neurotransmission, but the causal relationship between these phenomena is unclear. Reduced plasticity could lead to altered transmission, or reduced excitatory transmission could alter the ability to induce LTP. To help distinguish these possibilities, we compared LTP induction and baseline synaptic transmission at synapses between layer 5 cortical pyramidal neurons in slices of wild-type and Mecp2-null mice. Paired recordings reveal that LTP induction mechanisms are intact in Mecp2-null connections, even after the onset of symptoms. However, fewer connections were found in Mecp2-null mice and individual connections were weaker. These data suggest that loss of MeCP2 function reduces excitatory synaptic connectivity and that this precedes deficits in plasticity.
Figures
Figure 1.
Whole-cell recordings from monosynaptically connected layer 5 thick-tufted neurons. A, Pseudocolor (grayscale) confocal _z_-stack projection of four simultaneously patched cells filled with Alexa 594. B, Example monosynaptic responses (gray trace; average of 30 trials) time locked to presynaptic APs (black trace). C, Induction of spike-timing-dependent LTP by repeated pairing of presynaptic followed by postsynaptic APs (8–10 ms interval). D, Top, Plot of individual EPSP amplitudes (first in each train of 5) throughout the recording. The gray bar indicates time during which LTP was induced. Input resistance (_R_in) (center) and resting membrane potential (_V_m) (bottom) changed little through the duration of recording.
Figure 2.
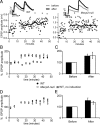
Robust LTP of monosynaptic connections between L5 pyramids in WT and _Mecp2_-null slices. A, Sample LTP experiments for WT (left; filled circles) and _Mecp2_-null (right; open circles) connections. Individual trials in each 4.5 min period were averaged (solid line); error bars were omitted for clarity. The insets show average (n = 30 trials) of first two EPSPs in the train during baseline (gray) and postinduction (black; 25th to 35th minutes) periods. B, Magnitude of LTP was similar in pairs from 2- to 3-week-old WT (N = 14) and _Mecp2_-null (N = 11) mice. The plot shows preinduction baseline normalized EPSP amplitude for the first response in the train. Each point represents mean ± SEM of 15 consecutive trails. Recordings with no induction protocol are also plotted (gray squares; N = 3). C, Bar plot showing average normalized baseline responses (“Before”; 30 trials per pair) from B and average of same number of responses centered around the 30th minute of each recording (“After”; 30 trials per pair). D, E, Summary of LTP experiments done in slices obtained from 4-week-old mice (WT, N = 8 connections; _Mecp2_-null, N = 7 connections). No significant difference in LTP magnitude between WT and _Mecp2_-null pairs was present at either developmental stage. Error bars indicate SEM.
Figure 3.
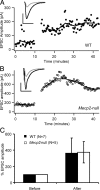
LTP induction using a pairing protocol. Evoked EPSCs were measured in L5 pyramidal neurons voltage clamped at −70 mV. A, Example of an LTP experiment in a WT slice. The inset shows averaged EPSC traces before (gray) and after (black) induction. Calibration: 100 pA, 20 ms. B, Example of a _Mecp2_-null neuron that underwent potentiation. The inset shows averaged EPSC traces before (gray) and after (black) induction. Calibration: 200 pA, 20 ms. C, Summary of LTP experiments using pairing protocol. Bar plot of mean normalized EPSC amplitude before (0 to 10th minute) and after (25th to 30th minute) pairing. Both WT and _Mecp2_-null synapses undergo strong potentiation when postsynaptic depolarization is provided. Error bars indicate SEM.
Figure 4.
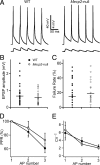
Properties of baseline synaptic transmission in L5 pyramid–pyramid connections in 2- to 3-week-old WT and _Mecp2_-null mice. A, Sample average postsynaptic responses of a synaptic connection in WT (left) and _Mecp2_-null (right) slices, and corresponding presynaptic spikes. B, EPSP amplitudes for the first EPSP in the train for each connection in WT (filled circles; N = 36 pairs) and _Mecp2_-null (empty circles; N = 24 pairs) mice. Horizontal bars show mean EPSP amplitude. C, No significant difference between genotypes was observed in the mean failure rates for the first EPSP in the train (circles, individual pairs; horizontal bars, mean failure rate for each genotype). D, Short-term plasticity of EPSPs in a train of three presynaptic action potentials delivered at 20 Hz. Mean percentage change (±SEM) with respect to first EPSP in the train (paired-pulse ratio) is plotted for each AP number. Both WT (filled circles) and _Mecp2_-null (open circles) synapses appear to depress to the same extent. E, No significant differences in the mean CV−2 (quantal content) can be observed between WT and _Mecp2_-null conditions during a train of APs. Each point represents mean CV−2 ± SEM.
Figure 5.
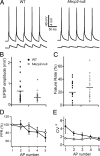
Properties of baseline synaptic transmission in L5 pyramid–pyramid connections in 4-week-old WT and _Mecp2_-null mice. A, Sample average postsynaptic responses of a monosynaptic connection in WT (left) and _Mecp2_-null (right) slices and corresponding presynaptic spikes (black). B, EPSP amplitudes for the first EPSP in the train for each connection in WT (filled circles) and _Mecp2_-null (empty circles) mice. Mean EPSP amplitude (horizontal bar) is ∼45% smaller in the _Mecp2_-null (N = 18) condition compared with WT (N = 19). The asterisk (*) indicates statistical significance (p < 0.05) by unpaired Student's t test. C, The apparent increase in mean failure rate (horizontal bars) was not statistically significant (p = 0.19; unpaired Student's t test). Failure rates for individual WT (filled circles) and _Mecp2_-null (open circles) synaptic connections are also shown. D, Short-term plasticity of EPSPs in a train of five pulses delivered at 20 Hz, plotted as PPR (percentage ± SEM) for each AP in the train. E, Mean CV−2 (±SEM) plotted for each EPSP in the train. CV−2 is higher for WT synapses and decreases with successive stimulation. At _Mecp2_-null synapses, CV−2 for the first two EPSPs in the train is significantly lower compared with WT and does not change significantly with successive stimuli (p < 0.05, two-factor ANOVA between WT and _Mecp2_-null curves).
Similar articles
- Synaptic maturation at cortical projections to the lateral amygdala in a mouse model of Rett syndrome.
Gambino F, Khelfaoui M, Poulain B, Bienvenu T, Chelly J, Humeau Y. Gambino F, et al. PLoS One. 2010 Jul 2;5(7):e11399. doi: 10.1371/journal.pone.0011399. PLoS One. 2010. PMID: 20625482 Free PMC article. - Hippocampal synaptic plasticity is impaired in the Mecp2-null mouse model of Rett syndrome.
Asaka Y, Jugloff DG, Zhang L, Eubanks JH, Fitzsimonds RM. Asaka Y, et al. Neurobiol Dis. 2006 Jan;21(1):217-27. doi: 10.1016/j.nbd.2005.07.005. Epub 2005 Aug 8. Neurobiol Dis. 2006. PMID: 16087343 - Learning and memory and synaptic plasticity are impaired in a mouse model of Rett syndrome.
Moretti P, Levenson JM, Battaglia F, Atkinson R, Teague R, Antalffy B, Armstrong D, Arancio O, Sweatt JD, Zoghbi HY. Moretti P, et al. J Neurosci. 2006 Jan 4;26(1):319-27. doi: 10.1523/JNEUROSCI.2623-05.2006. J Neurosci. 2006. PMID: 16399702 Free PMC article. - The impact of MeCP2 loss- or gain-of-function on synaptic plasticity.
Na ES, Nelson ED, Kavalali ET, Monteggia LM. Na ES, et al. Neuropsychopharmacology. 2013 Jan;38(1):212-9. doi: 10.1038/npp.2012.116. Epub 2012 Jul 11. Neuropsychopharmacology. 2013. PMID: 22781840 Free PMC article. Review. - Rett syndrome and the impact of MeCP2 associated transcriptional mechanisms on neurotransmission.
Monteggia LM, Kavalali ET. Monteggia LM, et al. Biol Psychiatry. 2009 Feb 1;65(3):204-10. doi: 10.1016/j.biopsych.2008.10.036. Epub 2008 Dec 5. Biol Psychiatry. 2009. PMID: 19058783 Free PMC article. Review.
Cited by
- Rett syndrome mutation MeCP2 T158A disrupts DNA binding, protein stability and ERP responses.
Goffin D, Allen M, Zhang L, Amorim M, Wang IT, Reyes AR, Mercado-Berton A, Ong C, Cohen S, Hu L, Blendy JA, Carlson GC, Siegel SJ, Greenberg ME, Zhou Z. Goffin D, et al. Nat Neurosci. 2011 Nov 27;15(2):274-83. doi: 10.1038/nn.2997. Nat Neurosci. 2011. PMID: 22119903 Free PMC article. - Genetic Landscape of Rett Syndrome Spectrum: Improvements and Challenges.
Vidal S, Xiol C, Pascual-Alonso A, O'Callaghan M, Pineda M, Armstrong J. Vidal S, et al. Int J Mol Sci. 2019 Aug 12;20(16):3925. doi: 10.3390/ijms20163925. Int J Mol Sci. 2019. PMID: 31409060 Free PMC article. Review. - Circuit-specific intracortical hyperconnectivity in mice with deletion of the autism-associated Met receptor tyrosine kinase.
Qiu S, Anderson CT, Levitt P, Shepherd GM. Qiu S, et al. J Neurosci. 2011 Apr 13;31(15):5855-64. doi: 10.1523/JNEUROSCI.6569-10.2011. J Neurosci. 2011. PMID: 21490227 Free PMC article. - Cell-type-specific synaptic imbalance and disrupted homeostatic plasticity in cortical circuits of ASD-associated Chd8 haploinsufficient mice.
Ellingford RA, Panasiuk MJ, de Meritens ER, Shaunak R, Naybour L, Browne L, Basson MA, Andreae LC. Ellingford RA, et al. Mol Psychiatry. 2021 Jul;26(7):3614-3624. doi: 10.1038/s41380-021-01070-9. Epub 2021 Apr 9. Mol Psychiatry. 2021. PMID: 33837267 Free PMC article. - Microglia contribute to circuit defects in Mecp2 null mice independent of microglia-specific loss of Mecp2 expression.
Schafer DP, Heller CT, Gunner G, Heller M, Gordon C, Hammond T, Wolf Y, Jung S, Stevens B. Schafer DP, et al. Elife. 2016 Jul 26;5:e15224. doi: 10.7554/eLife.15224. Elife. 2016. PMID: 27458802 Free PMC article.
References
- Amir RE, Van den Veyver IB, Wan M, Tran CQ, Francke U, Zoghbi HY. Rett syndrome is caused by mutations in X-linked MECP2, encoding methyl-CpG-binding protein 2. Nat Genet. 1999;23:185–188. - PubMed
- Armstrong DD. Neuropathology of Rett syndrome. Ment Retard Dev Disabil Res Rev. 2002;8:72–76. - PubMed
- Artola A, Singer W. Long-term potentiation and NMDA receptors in rat visual cortex. Nature. 1987;330:649–652. - PubMed
- Asaka Y, Jugloff DG, Zhang L, Eubanks JH, Fitzsimonds RM. Hippocampal synaptic plasticity is impaired in the Mecp2-null mouse model of Rett syndrome. Neurobiol Dis. 2006;21:217–227. - PubMed
- Bear MF, Press WA, Connors BW. Long-term potentiation in slices of kitten visual cortex and the effects of NMDA receptor blockade. J Neurophysiol. 1992;67:841–851. - PubMed
Publication types
MeSH terms
Substances
LinkOut - more resources
Full Text Sources
Other Literature Sources
Medical
Molecular Biology Databases


