Quantitative miRNA expression analysis: comparing microarrays with next-generation sequencing - PubMed (original) (raw)
Comparative Study
. 2009 Nov;15(11):2028-34.
doi: 10.1261/rna.1699809. Epub 2009 Sep 10.
Affiliations
- PMID: 19745027
- PMCID: PMC2764476
- DOI: 10.1261/rna.1699809
Comparative Study
Quantitative miRNA expression analysis: comparing microarrays with next-generation sequencing
Hanni Willenbrock et al. RNA. 2009 Nov.
Abstract
Recently, next-generation sequencing has been introduced as a promising, new platform for assessing the copy number of transcripts, while the existing microarray technology is considered less reliable for absolute, quantitative expression measurements. Nonetheless, so far, results from the two technologies have only been compared based on biological data, leading to the conclusion that, although they are somewhat correlated, expression values differ significantly. Here, we use synthetic RNA samples, resembling human microRNA samples, to find that microarray expression measures actually correlate better with sample RNA content than expression measures obtained from sequencing data. In addition, microarrays appear highly sensitive and perform equivalently to next-generation sequencing in terms of reproducibility and relative ratio quantification.
Figures
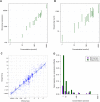
FIGURE 1.
Comparison of microarray and sequencing data. (A,B) Ninety-five percent confidence intervals for sample A intensities versus RNA concentrations. (C) Illumina sequencing ratios versus microarray ratios. (D) Bar plot of the undetected fraction (false discovery rate) of synthetic RNAs at each concentration. The lower the bar, the better sensitivity.
FIGURE 2.
Histogram of read variants’ lengths in Illumina sequencing data. The black bar shows the number of exact sequence read matches for all synthetic RNAs, while the gray bars show the number of length variants that are perfect matches but shorter or longer than the synthetic RNA it resembles the most. “Relative length” is the read length relative to the length of the synthetic RNA it resembles the most.
FIGURE 3.
Histogram of the alignment distances (sum of mismatches and gaps in alignments) between the human let-7 family sequences (black) according to the miRBase sequences and unique variant reads aligning to the let-7 family members (gray) as its best match. In comparison, many variant read sequences have much higher alignment distances to their closest matching synthetic RNA sequence than alignment distances observed within the let-7 miRNA family.
Similar articles
- Measuring microRNAs: comparisons of microarray and quantitative PCR measurements, and of different total RNA prep methods.
Ach RA, Wang H, Curry B. Ach RA, et al. BMC Biotechnol. 2008 Sep 11;8:69. doi: 10.1186/1472-6750-8-69. BMC Biotechnol. 2008. PMID: 18783629 Free PMC article. - Systematic comparison of microarray profiling, real-time PCR, and next-generation sequencing technologies for measuring differential microRNA expression.
Git A, Dvinge H, Salmon-Divon M, Osborne M, Kutter C, Hadfield J, Bertone P, Caldas C. Git A, et al. RNA. 2010 May;16(5):991-1006. doi: 10.1261/rna.1947110. Epub 2010 Apr 1. RNA. 2010. PMID: 20360395 Free PMC article. - How the RNA isolation method can affect microRNA microarray results.
Podolska A, Kaczkowski B, Litman T, Fredholm M, Cirera S. Podolska A, et al. Acta Biochim Pol. 2011;58(4):535-40. Epub 2011 Dec 6. Acta Biochim Pol. 2011. PMID: 22146134 - Expression profiling of microRNAs by deep sequencing.
Creighton CJ, Reid JG, Gunaratne PH. Creighton CJ, et al. Brief Bioinform. 2009 Sep;10(5):490-7. doi: 10.1093/bib/bbp019. Epub 2009 Mar 30. Brief Bioinform. 2009. PMID: 19332473 Free PMC article. Review. - Next generation sequencing of microbial transcriptomes: challenges and opportunities.
van Vliet AH. van Vliet AH. FEMS Microbiol Lett. 2010 Jan;302(1):1-7. doi: 10.1111/j.1574-6968.2009.01767.x. Epub 2009 Aug 21. FEMS Microbiol Lett. 2010. PMID: 19735299 Review.
Cited by
- Potential pitfalls in microRNA profiling.
Chugh P, Dittmer DP. Chugh P, et al. Wiley Interdiscip Rev RNA. 2012 Sep-Oct;3(5):601-16. doi: 10.1002/wrna.1120. Epub 2012 May 7. Wiley Interdiscip Rev RNA. 2012. PMID: 22566380 Free PMC article. Review. - The miR-15/107 group of microRNA genes: evolutionary biology, cellular functions, and roles in human diseases.
Finnerty JR, Wang WX, Hébert SS, Wilfred BR, Mao G, Nelson PT. Finnerty JR, et al. J Mol Biol. 2010 Sep 24;402(3):491-509. doi: 10.1016/j.jmb.2010.07.051. Epub 2010 Aug 1. J Mol Biol. 2010. PMID: 20678503 Free PMC article. Review. - Expression of herpes simplex virus 1 microRNAs in cell culture models of quiescent and latent infection.
Jurak I, Hackenberg M, Kim JY, Pesola JM, Everett RD, Preston CM, Wilson AC, Coen DM. Jurak I, et al. J Virol. 2014 Feb;88(4):2337-9. doi: 10.1128/JVI.03486-13. Epub 2013 Dec 4. J Virol. 2014. PMID: 24307587 Free PMC article. - Differences in microRNA detection levels are technology and sequence dependent.
Leshkowitz D, Horn-Saban S, Parmet Y, Feldmesser E. Leshkowitz D, et al. RNA. 2013 Apr;19(4):527-38. doi: 10.1261/rna.036475.112. Epub 2013 Feb 19. RNA. 2013. PMID: 23431331 Free PMC article. - Differential glucose-regulation of microRNAs in pancreatic islets of non-obese type 2 diabetes model Goto-Kakizaki rat.
Esguerra JL, Bolmeson C, Cilio CM, Eliasson L. Esguerra JL, et al. PLoS One. 2011 Apr 7;6(4):e18613. doi: 10.1371/journal.pone.0018613. PLoS One. 2011. PMID: 21490936 Free PMC article.
References
- Akmaev VR, Wang CJ. Correction of sequence-based artifacts in serial analysis of gene expression. Bioinformatics. 2004;20:1254–1263. - PubMed
- Arikawa E, Sun Y, Wang J, Zhou Q, Ning B, Dial SL, Guo L, Yang J. Cross-platform comparison of SYBR® Green real-time PCR with TaqMan PCR, microarrays and other gene expression measurement technologies evaluated in the MicroArray Quality Control (MAQC) study. BMC Genomics. 2008;9:328. doi: 10.1186/1471-2164-9-328. - DOI - PMC - PubMed
- Beissbarth T, Hyde L, Smyth GK, Job C, Boon WM, Tan SS, Scott HS, Speed TP. Statistical modeling of sequencing errors in SAGE libraries. Bioinformatics. 2004;20(Suppl 1):i31–i39. - PubMed
Publication types
MeSH terms
Substances
LinkOut - more resources
Full Text Sources
Other Literature Sources
Molecular Biology Databases


