Entropic organization of interphase chromosomes - PubMed (original) (raw)
Entropic organization of interphase chromosomes
Peter R Cook et al. J Cell Biol. 2009.
Abstract
Chromosomes are not distributed randomly in nuclei. Appropriate positioning can activate (or repress) genes by bringing them closer to active (or inactive) compartments like euchromatin (or heterochromatin), and this is usually assumed to be driven by specific local forces (e.g., involving H bonds between nucleosomes or between nucleosomes and the lamina). Using Monte Carlo simulations, we demonstrate that nonspecific (entropic) forces acting alone are sufficient to position and shape self-avoiding polymers within a confining sphere in the ways seen in nuclei. We suggest that they can drive long flexible polymers (representing gene-rich chromosomes) to the interior, compact/thick ones (and heterochromatin) to the periphery, looped (but not linear) ones into appropriately shaped (ellipsoidal) territories, and polymers with large terminal beads (representing centromeric heterochromatin) into peripheral chromocenters. Flexible polymers tend to intermingle less than others, which is in accord with observations that gene-dense (and so flexible) chromosomes make poor translocation partners. Thus, entropic forces probably participate in the self-organization of chromosomes within nuclei.
Figures
Figure 1.
Monte Carlo simulations of two sets of five polymers confined within a sphere. Polymers were allowed to diffuse in the computer until they reached equilibrium. In each case, typical configurations (left), normalized radial probabilities (middle), and cartoons illustrating major determinants of position (right) are shown for the volume density (φ) indicated. All polymers are self-avoiding (i.e., no bead occupies the same space as another), and, unless stated otherwise, there are 50 beads (diameter of 30 nm) in a polymer with a contour length of 1.5 µm (representing 150 kbp) and a persistence length of 40 nm. (In each case, increasing length 10-fold yields essentially similar patterns [see Monte Carlo simulations of confined chromatin segments].) (A) Five stiff (blue) and five flexible (red) polymers with persistence lengths (ξ) of 90 and 40 nm. (i) At low volume fractions, stiff polymers tend to lie more internally than flexible ones (difference significant, P < 0.0001; unpaired Student’s _t_ test). The cartoon shows that stiff polymers statistically occupy more volume and so lose more entropy when positioned in the (larger) gray volume close to the wall; as a consequence, their centers of mass tend to be concentrated in the yellow volume at the center. (ii and iii) At volume fractions >11%, this trend reverses, and stiff polymers tend to be peripheral (for iii, difference significant, P < 0.0001; unpaired Student’s t test). This is what is seen experimentally (check), where stiff, heterochromatic regions are often peripheral. Data with different length and/or persistence lengths give qualitatively similar trends (see Materials and methods). For a description of the cartoon, see The radial positioning of chromosome territories and Monte Carlo simulations of confined chromatin segments. (B) Five compact (blue) and five open/swollen (red) polymers. Compaction is achieved by allowing monomers in one set to interact with other monomers in the same polymer with an attractive potential of 1 kBT in the range between 30 and 50 nm (center to center distances). (i and ii) Compact polymers are more peripheral at both low and high volume fractions, which is in accord with what is seen experimentally (as heterochromatic regions are more compact; check). The cartoon shows that this entropic bias is the result of compact fibers being able to approach closer to the confining wall (i.e., the inaccessible gray volume is less, and the accessible yellow volume is more). (C) Five thick (30-nm beads; blue) and five thin (25-nm beads; red) polymers. (i) At low volume fractions, thicker polymers tend to be slightly more internal (difference significant, P < 0.005; Student’s t test). The cartoon shows that thicker polymers tend to be excluded from a larger gray volume. (ii) At high volume fractions, thicker polymers tend to be peripheral (difference significant, P < 0.0001; Student’s t test); this is what is seen experimentally (check). For a description of the cartoon, see The radial positioning of chromosome territories and Monte Carlo simulations of confined chromatin segments. (D) Five long (blue) and five short (red) polymers. (i and ii) Longer polymers tend to be more internal, which is not found experimentally (X). The cartoon shows that the long polymers occupy more volume and so tend to be excluded from the larger gray volume (to occupy the smaller yellow volume toward the center).
Figure 2.
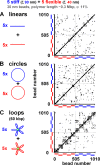
Contacts within and between polymers with different conformations determined using Monte Carlo simulations. Sets of 10 linear, circular, or looped polymers (each a string of 101 30-nm beads representing 303 kbp) were confined in a sphere (radius of 0.3 µm; φ = 11%) and allowed to diffuse in the computer until they reached equilibrium; contacts (defined as ≤60 nm center to center distance) that each bead made with others are marked by a cross (+; which appears as a dot at low magnification) on the plot. In each, five polymers were flexible (ξ = 40 nm; beads 1–101, 102–202,…, 405–505), and five were stiff (ξ = 90 nm; beads 506–606, 607–707,…, 910–1,010). (A) Beads are not so likely to contact other beads in the same fiber, indicating that fibers intermingle without forming discrete territories (inter- and intrachain contacts, 30% and 70%, respectively). There are also more contacts in the top right quadrant than the bottom left one, showing that contacts between stiff fibers are more numerous (flexible–flexible contacts, 3,480 [16%]; stiff–flexible contacts, 850 [39%]; stiff–stiff contacts, 978 [45%]). (B) The pattern is largely the same (inter- and intrachain contacts, 30% and 70%, respectively). There are more stiff–stiff contacts (top right quadrant) and fewer flexible–flexible ones (bottom left quadrant; flexible–flexible contacts, 390 [17%]; stiff–flexible contacts, 796 [35%]; stiff–stiff contacts, 1,100 [48%]). (C) Rosettes, each with five 60-kbp loops, generated by tethering together beads (green) at positions 1, 21, 41, 61, 81, and 101 in each fiber. The 10 6 × 6 grids along the diagonal mark these forced contacts. There are many other contacts within each grid (and many fewer interfiber contacts), indicating that a bead in one fiber is more likely to contact others in the same fiber; this reflects the formation of more discrete territories (inter- and intrachain contacts, 20% and 80%, respectively). Stiff fibers are again more likely to contact other stiff fibers (flexible–flexible contacts, 730 [34.6%]; stiff–flexible contacts, 311 [14.7%]; stiff–stiff contacts, 848 [50.7%]).
Figure 3.
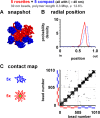
Positioning rosettes and compact (linear) fibers. Sets of five rosettes (each with 10 30-kbp loops; red) and five compact (linear) fibers (blue) were confined in a sphere (radius of 0.3 µm; φ = 12.6%) and allowed to diffuse in the computer until they reached equilibrium. Each fiber was a string of 101 30-nm beads representing 303 kbp with 40-nm persistence length. Fibers 1–5 were rosettes and made of beads 1–101, 102–202,…, 405–505; each rosette (with 10 30-kbp loops) was formed by tethering together beads at positions 1, 11, 21, etc., in the fiber. Fibers 6–10 were compact and made of beads 506–606, 607–707,…, 910–1,010; compaction was achieved using an interaction of 1 kBT in the range of 30–50 nm between each monomer in any one fiber. (A) Snapshot of one simulation. Compact fibers (blue) are expected to be more heterochromatic and are more peripheral, as seen experimentally. (B) Normalized radial probability distributions of beads in rosettes (red) and compact fibers (blue); the latter tend to be peripheral. (C) Contact map (determined as in Fig. 2; crosses [+; which appear as dots at low magnification] mark contacts). The five 11 × 11 grids along the diagonal nearest the origin mark forced contacts in rosettes; additional contacts within each grid reflect many other interfiber contacts and territory formation. The five clusters on the diagonal distant from the origin mark interfiber contacts within each of the five compact fibers; they also form territories (inter- and intrachain contacts, 4% and 96%, respectively). There were many contacts in the quadrants at top left and bottom right, showing that rosettes preferred to pack against compact fibers (rosette–rosette contacts, 136 [3.8%]; rosette–compact contacts, 266 [46.5%]; compact–compact contacts, 170 [29.7%]).
Figure 4.
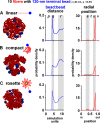
Positioning of centromeres in nuclei. Sets of 10 linear, compact, and rosetted fibers (red; ξ = 40 nm) bearing one large terminal bead of 120 nm representing a telocentric centromere (blue) were confined in a sphere (radius of 0.3 µm; φ = 12.5%) and allowed to diffuse in the computer until they reached equilibrium. Typical snapshots are shown on the left, distances (in simulation units, where 1 unit corresponds to 30 nm) between terminal beads in the middle, and normalized probabilities that territories are found at a given radial position on the right. In all cases, terminal beads are often peripheral and clustered. In zones p and v, probabilities are zero, as the center of mass of a terminal bead cannot approach within 120 nm of that of another terminal bead or within 60 nm of the confining wall. The peaks in zone q reflect clustering of terminal beads, and those in zone r reflect the increased probability that two terminal beads will be found randomly in the larger volume found at these separations. The small peak in zone s arises because probabilities seen with a random distribution rise progressively toward the periphery, but here, terminal beads tend to be concentrated in zone u to leave fewer in zone t. (A) 10 linear fibers of 300 kbp, each with one additional large terminal bead. (B) 10 (linear) compact fibers of 300 kbp plus a large terminal bead; compaction is driven by 1 kBT interaction as in Fig. 1 B. (C) Nine 30-kbp loops formed as in Fig. 2 C, each with one linear 30-kbp extension bearing the large terminal bead.
Similar articles
- Packing of the polynucleosome chain in interphase chromosomes: evidence for a contribution of crowding and entropic forces.
Hancock R. Hancock R. Semin Cell Dev Biol. 2007 Oct;18(5):668-75. doi: 10.1016/j.semcdb.2007.08.006. Epub 2007 Aug 25. Semin Cell Dev Biol. 2007. PMID: 17904880 Review. - Non-specific interactions are sufficient to explain the position of heterochromatic chromocenters and nucleoli in interphase nuclei.
de Nooijer S, Wellink J, Mulder B, Bisseling T. de Nooijer S, et al. Nucleic Acids Res. 2009 Jun;37(11):3558-68. doi: 10.1093/nar/gkp219. Epub 2009 Apr 9. Nucleic Acids Res. 2009. PMID: 19359359 Free PMC article. - Chromatin Domains: The Unit of Chromosome Organization.
Dixon JR, Gorkin DU, Ren B. Dixon JR, et al. Mol Cell. 2016 Jun 2;62(5):668-80. doi: 10.1016/j.molcel.2016.05.018. Mol Cell. 2016. PMID: 27259200 Free PMC article. Review. - Repulsive forces between looping chromosomes induce entropy-driven segregation.
Bohn M, Heermann DW. Bohn M, et al. PLoS One. 2011 Jan 4;6(1):e14428. doi: 10.1371/journal.pone.0014428. PLoS One. 2011. PMID: 21245914 Free PMC article. - Heterogeneous flexibility can contribute to chromatin segregation in the cell nucleus.
Girard M, de la Cruz MO, Marko JF, Erbaş A. Girard M, et al. Phys Rev E. 2024 Jul;110(1-1):014403. doi: 10.1103/PhysRevE.110.014403. Phys Rev E. 2024. PMID: 39160964 Free PMC article.
Cited by
- Modelling of crowded polymers elucidate effects of double-strand breaks in topological domains of bacterial chromosomes.
Dorier J, Stasiak A. Dorier J, et al. Nucleic Acids Res. 2013 Aug;41(14):6808-15. doi: 10.1093/nar/gkt480. Epub 2013 Jun 5. Nucleic Acids Res. 2013. PMID: 23742906 Free PMC article. - Shaping the genome via lengthwise compaction, phase separation, and lamina adhesion.
Brahmachari S, Contessoto VG, Di Pierro M, Onuchic JN. Brahmachari S, et al. Nucleic Acids Res. 2022 May 6;50(8):4258-4271. doi: 10.1093/nar/gkac231. Nucleic Acids Res. 2022. PMID: 35420130 Free PMC article. - Perinuclear distribution of heterochromatin in developing C. elegans embryos.
Grant J, Verrill C, Coustham V, Arneodo A, Palladino F, Monier K, Khalil A. Grant J, et al. Chromosome Res. 2010 Dec;18(8):873-85. doi: 10.1007/s10577-010-9175-2. Epub 2010 Nov 30. Chromosome Res. 2010. PMID: 21116703 - Space exploration by the promoter of a long human gene during one transcription cycle.
Larkin JD, Papantonis A, Cook PR, Marenduzzo D. Larkin JD, et al. Nucleic Acids Res. 2013 Feb 1;41(4):2216-27. doi: 10.1093/nar/gks1441. Epub 2013 Jan 8. Nucleic Acids Res. 2013. PMID: 23303786 Free PMC article. - Nonequilibrium Biophysical Processes Influence the Large-Scale Architecture of the Cell Nucleus.
Agrawal A, Ganai N, Sengupta S, Menon GI. Agrawal A, et al. Biophys J. 2020 May 5;118(9):2229-2244. doi: 10.1016/j.bpj.2019.11.017. Epub 2019 Nov 22. Biophys J. 2020. PMID: 31818465 Free PMC article.
References
- Asakura S., Oosawa F. 1958. Interactions between particles suspended in solutions of macromolecules.Journal of Polymer Science. 33:183–192 doi:<10.1002/pol.1958.1203312618> - DOI
- Berg H.C. 1993. Random Walks in Biology. Princeton University Press, Princeton, NJ: 152 pp
- Bolzer A., Kreth G., Solovei I., Koehler D., Saracoglu K., Fauth C., Müller S., Eils R., Cremer C., Speicher M.R., Cremer T. 2005. Three-dimensional maps of all chromosomes in human male fibroblast nuclei and prometaphase rosettes.PLoS Biol. 3:e157 doi:<10.1371/journal.pbio.0030157> - DOI - PMC - PubMed
Publication types
MeSH terms
Substances
LinkOut - more resources
Full Text Sources
Other Literature Sources


