CLIP-170-dependent capture of membrane organelles by microtubules initiates minus-end directed transport - PubMed (original) (raw)
CLIP-170-dependent capture of membrane organelles by microtubules initiates minus-end directed transport
Alexis J Lomakin et al. Dev Cell. 2009 Sep.
Abstract
Cytoplasmic microtubules (MTs) continuously grow and shorten at free plus ends. During mitosis, this dynamic behavior allows MTs to capture chromosomes to initiate their movement to the spindle poles; however, the role of MT dynamics in capturing organelles for transport in interphase cells has not been demonstrated. Here we use Xenopus melanophores to test the hypothesis that MT dynamics significantly contribute to the efficiency of MT minus-end directed transport of membrane organelles. We demonstrate that initiation of transport of membrane-bounded melanosomes (pigment granules) to the cell center involves their capture by MT plus ends, and that inhibition of MT dynamics or loss of the MT plus-end tracking protein CLIP-170 from MT tips dramatically inhibits pigment aggregation. We conclude that MT dynamics are required for the initiation of MT transport of membrane organelles in interphase cells, and that +TIPs such as CLIP-170 play an important role in this process.
Figures
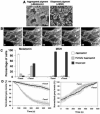
Figure 1. Stabilization of microtubules with taxol inhibits aggregation of melanosomes
(A) Phase-contrast images of melanophores treated with MSH (left) or melatonin (right) to disperse or aggregate melanosomes. Bar, 20 μm. (B) Time series of images of a melanophore with fluorescently labeled MTs treated with melatonin to induce pigment aggregation; after capture by the growing MT tip (arrow) a melanosome (arrowhead) starts moving along the MT toward the cell center. Bar, 2 μm. See also Supplemental Videos 3 and 4. (C) Quantification of responses to melatonin or MSH, applied to induce pigment aggregation or dispersion, of control non-treated melanophores or melanophores treated with the MT-stabilizing drug taxol; the data are expressed as the percentages of cells with aggregated (white bars), partially dispersed (grey bars) or completely dispersed (black bars) pigment. Quantification was performed at 10 min (aggregation) or 15 min (dispersion) after stimulation.(D) Quantification of kinetics of pigment aggregation (left panel) or dispersion (right panel) in control non-treated (white squares) or taxol-treated (black squares) melanophores; data are expressed as the percentage of change with time in the grey levels within the cell outlines; 100% corresponds to the fully dispersed state.
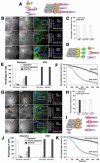
Figure 2. Overexpression of EB3-GFP or GFP-CLIP-170 tail removes CLIP-170 and p150Glued from the plus ends of MTs, and inhibit pigment aggregation
(A) Hierarchy of plus-end accumulation of +TIPs: p150Glued binds MT plus ends via CLIP-170 or EB1, CLIP-170 binding is mediated by EB1, and EB1 directly binds tubulin molecules in the MT wall; CLIP-170 and p150Glued can bind tubulin directly, and these interactions contribute to their plus-end localization, but are not sufficient to mediate it, and therefore are not shown. (B and G) Immunostaining of EB3-GFP-overexpressing (B) or GFP-CLIP-170 tail-overexpressing (G) cells with antibodies against EB1, CLIP-170, or p150Glued; examples of low and high magnification images are shown for each +TIP (with color codes indicated above the merged images). Representative line scan analyses of protein accumulation at MT tips in the boxed regions are shown on the right. Bars, 10 μm (left columns) or 2.5 μm (middle columns). (C and H) Fractions of MT plus ends immunostained for EB1, CLIP-170, or p150Glued in the EB3-GFP-overexpressing (C) or GFP-CLIP-170 tail-overexpressing (H) cells. (D and I) Diagrams illustrating the effect of EB3-GFP (D) or CLIP-170 tail (I) overexpression on the composition of +TIPs at MT plus ends; EB3-GFP displaces all major +TIPs (EB1, CLIP-170, and p150Glued) from MT plus ends, whereas GFP-CLIP-170 tail displaces CLIP-170, and p150Glued, but not EB1. (E and J) Quantification of responses of EB3-GFP (E) or GFP-CLIP-170 tail-overexpressing (J) cells to melatonin or MSH; the data is expressed as the percentages of cells with aggregated (white bars), partially dispersed (grey bars) or completely dispersed (black bars) pigment. (F and K) Quantification of kinetics of pigment aggregation in the cells overexpressing EB3-GFP (F) or GFP-CLIP-170 (K); the data is expressed as a decrease in the values the grey levels within the cell outlines with time.
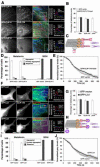
Figure 3. Overexpression of the CLIP-170 head or LIS1 displace p150Glued from MT plus ends, but does not affect pigment aggregation
(A and F) Immunostaining of cells overexpressing GFP-CLIP-170 head or GFP-LIS1 with antibodies against EB1, CLIP-170, or p150Glued; examples of low and high magnification images are shown for each +TIP (with color codes indicated above the merged images). Representative line scan analyses of protein accumulation at MT tips are shown on the right. Bars, 10 μm (left columns) or 2.5 μm (middle columns). (B and G) Fractions of MT plus ends immunostained for EB1, CLIP-170 or p150Glued in the GFP-CLIP-170 head- (B) or GFP-LIS1- (G) overexpressing cells. (C and H) Diagrams illustrating the effects of CLIP-170 head (C) or LIS1 (H) overexpression on the composition of +TIPs at MT plus ends; CLIP-170 head or LIS1 displace p150Glued, but not CLIP-170 or EB1 from the MT plus ends. (D and I) Quantification of responses of GFP-CLIP-170 head (D) or GFP-LIS1- (I) overexpressing cells to melatonin or MSH; the data is expressed as the percentages of cells with aggregated (white bars), partially dispersed (grey bars) or completely dispersed (black bars) pigment. (E and J) Quantification of kinetics of pigment aggregation in the cells overexpressing GFP-CLIP-170 head (E) or GFP-LIS1 (J); the data is expressed as a decrease in the values the grey levels within the cell outlines with time.
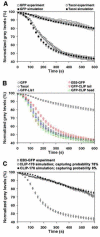
Figure 4. Changes in the parameters of MT dynamic instability and bidirectional movement of melanosomes along MTs do not affect significantly pigment aggregation kinetics
(A) Comparison of kinetics of pigment aggregation for cells overexpressing GFP or treated with taxol determined experimentally (open symbols), or computed using the parameters of MT dynamic instability and bi-directional melanosome movement shown in Tables 1 and 2 (filled symbols). Data are expressed as the percentage of change with time in the grey levels within the cell outlines. Computational simulations accurately reproduce kinetics of pigment aggregation in the presence (circles) or absence (squares) of taxol. (B) Computed kinetics of pigment aggregation for the taxol-treated cells, or cells overexpressing GFP, EB3-GFP, GFP-CLIP-170 tail, GFP-CLIP-170 head, or GFPLIS1. Overexpression of dominant-negative constructs, which alter the composition of +TIPs at the MT plus ends (EB3-GFP, GFP-CLIP-170 tail, GFP-CLIP-170 head, or GFPLIS1), does not significantly inhibit pigment aggregation kinetics. (C) Comparison of the kinetics of pigment aggregation experimentally measured in the cells overexpressing EB3-GFP (open squares), with the kinetics computed with the assumption that the probability of capturing of melanosomes by the CLIP-170-enriched MT plus ends is 78% (open circles) or 8% (closed circles). The kinetics computed at a low capturing probability closely matches the EB3-GFP kinetics, which confirms that a decreased pigment aggregation rate seen in cells lacking CLIP-170 at the MT plus ends could be explained by a reduced capturing ability of MTs alone.
Figure 5. Binding of CLIP-170 to melanosomes
(A) Immunoblotting of cell extract (E) or melanosomes isolated from melanophores with dispersed (D) or aggregated (A) pigment with an antibody against mammalian CLIP-170 (α-CLIP-170; left lanes), or a soluble marker glyceraldehyde-3-phosphate dehydrogenase (α-GAPDH; right lanes). CLIP-170, but not GAPDH co-purifies with melanosomes. Loading of the samples were equalized to compare the amounts of CLIP-170 and GAPDH between the melanosome preparations, and between the fractions of cytosol and melanosome extract by equalizing across the samples concentrations of melanosomes estimated by measuring optical density of the melanosome suspension at 350 nm, and by adjusting the volumes of the melanosome supernatant and extract to the volume of the initial melanosome suspension . (B) Model for CLIP-170 involvement in the binding of melanosomes to MTs. CLIP-170 concentrated at the MT plus end binds an adaptor protein on the melanosome surface, and this binding facilitates the interaction of the pigment granule-bound dynein with the MT lattice.
Similar articles
- Stimulation of microtubule-based transport by nucleation of microtubules on pigment granules.
Semenova I, Gupta D, Usui T, Hayakawa I, Cowan A, Rodionov V. Semenova I, et al. Mol Biol Cell. 2017 Jun 1;28(11):1418-1425. doi: 10.1091/mbc.E16-08-0571. Epub 2017 Apr 5. Mol Biol Cell. 2017. PMID: 28381426 Free PMC article. - Stimulation of the CLIP-170--dependent capture of membrane organelles by microtubules through fine tuning of microtubule assembly dynamics.
Lomakin AJ, Kraikivski P, Semenova I, Ikeda K, Zaliapin I, Tirnauer JS, Akhmanova A, Rodionov V. Lomakin AJ, et al. Mol Biol Cell. 2011 Nov;22(21):4029-37. doi: 10.1091/mbc.E11-03-0260. Epub 2011 Aug 31. Mol Biol Cell. 2011. PMID: 21880898 Free PMC article. - Melanophores for microtubule dynamics and motility assays.
Ikeda K, Semenova I, Zhapparova O, Rodionov V. Ikeda K, et al. Methods Cell Biol. 2010;97:401-14. doi: 10.1016/S0091-679X(10)97021-0. Methods Cell Biol. 2010. PMID: 20719282 Review. - Regulation of microtubule-based transport by MAP4.
Semenova I, Ikeda K, Resaul K, Kraikivski P, Aguiar M, Gygi S, Zaliapin I, Cowan A, Rodionov V. Semenova I, et al. Mol Biol Cell. 2014 Oct 15;25(20):3119-32. doi: 10.1091/mbc.E14-01-0022. Epub 2014 Aug 20. Mol Biol Cell. 2014. PMID: 25143402 Free PMC article. - Molecular mechanisms of pigment transport in melanophores.
Tuma MC, Gelfand VI. Tuma MC, et al. Pigment Cell Res. 1999 Oct;12(5):283-94. doi: 10.1111/j.1600-0749.1999.tb00762.x. Pigment Cell Res. 1999. PMID: 10541038 Review.
Cited by
- Measuring and modeling forces generated by microtubules.
Gudimchuk NB, Alexandrova VV. Gudimchuk NB, et al. Biophys Rev. 2023 Oct 13;15(5):1095-1110. doi: 10.1007/s12551-023-01161-7. eCollection 2023 Oct. Biophys Rev. 2023. PMID: 37974983 Free PMC article. Review. - Stimulation of microtubule-based transport by nucleation of microtubules on pigment granules.
Semenova I, Gupta D, Usui T, Hayakawa I, Cowan A, Rodionov V. Semenova I, et al. Mol Biol Cell. 2017 Jun 1;28(11):1418-1425. doi: 10.1091/mbc.E16-08-0571. Epub 2017 Apr 5. Mol Biol Cell. 2017. PMID: 28381426 Free PMC article. - Directed microtubule growth, +TIPs, and kinesin-2 are required for uniform microtubule polarity in dendrites.
Mattie FJ, Stackpole MM, Stone MC, Clippard JR, Rudnick DA, Qiu Y, Tao J, Allender DL, Parmar M, Rolls MM. Mattie FJ, et al. Curr Biol. 2010 Dec 21;20(24):2169-77. doi: 10.1016/j.cub.2010.11.050. Epub 2010 Dec 9. Curr Biol. 2010. PMID: 21145742 Free PMC article. - Microtubule-based transport in filamentous fungi.
Egan MJ, McClintock MA, Reck-Peterson SL. Egan MJ, et al. Curr Opin Microbiol. 2012 Dec;15(6):637-45. doi: 10.1016/j.mib.2012.10.003. Epub 2012 Nov 2. Curr Opin Microbiol. 2012. PMID: 23127389 Free PMC article. Review. - Use of virtual cell in studies of cellular dynamics.
Slepchenko BM, Loew LM. Slepchenko BM, et al. Int Rev Cell Mol Biol. 2010;283:1-56. doi: 10.1016/S1937-6448(10)83001-1. Int Rev Cell Mol Biol. 2010. PMID: 20801417 Free PMC article. Review.
References
- Akhmanova A, Steinmetz MO. Tracking the ends: a dynamic protein network controls the fate of microtubule tips. Nat Rev Mol Cell Biol. 2008;9:309–322. - PubMed
- Caviston JP, Holzbaur EL. Microtubule motors at the intersection of trafficking and transport. Trends Cell Biol. 2006;16:530–537. - PubMed
- Cheeseman IM, Desai A. Molecular architecture of the kinetochoremicrotubule interface. Nat Rev Mol Cell Biol. 2008;9:33–46. - PubMed
Publication types
MeSH terms
Substances
LinkOut - more resources
Full Text Sources
Other Literature Sources


