Negative shift in the glycine reversal potential mediated by a Ca2+- and pH-dependent mechanism in interneurons - PubMed (original) (raw)
Negative shift in the glycine reversal potential mediated by a Ca2+- and pH-dependent mechanism in interneurons
Yuil Kim et al. J Neurosci. 2009.
Abstract
Cartwheel cells are glycinergic auditory interneurons which fire Na(+)- and Ca(2+)-dependent spike bursts, termed complex spikes, and which synapse on both principal cells and one another. The reversal potential for glycine (E(gly)) can be hyperpolarizing or depolarizing in cartwheel cells, and many cells are even excited by glycine. We explored the role of spike activity in determining E(gly) in mouse cartwheel cells using gramicidin perforated-patch recording. E(gly) was found to shift toward more negative potentials after a period of complex spiking or Ca(2+) spiking induced by depolarization, thus enhancing glycine's inhibitory effect for approximately 30 s following cessation of spiking. Combined perforated patch electrophysiology and imaging studies showed that the negative E(gly) shift was triggered by a Ca(2+)-dependent intracellular acidification. The effect on E(gly) was likely caused by bicarbonate-Cl(-) exchanger-mediated reduction in intracellular Cl(-), as H(2)DIDS and removal of HCO(3)(-)/CO(2) inhibited the negative E(gly) shift. The outward Cl(-) flux underlying the negative shift in E(gly) opposed a positive shift triggered by passive Cl(-) redistribution during the depolarization. Thus, a Ca(2+)-dependent mechanism serves to maintain or enhance the strength of inhibition in the face of increased excitatory activity.
Figures
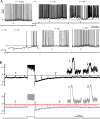
Figure 1.
Three types of glycine response in spontaneously spiking CWCs. A–C, Examples of excitatory (A), mixed (B), and inhibitory (C) responses to a glycine puff during spontaneous activity. The duration of the glycine puff is indicated with a bar, and the glycine concentrations were 0.5, 0.5, 0.5, 0.5, 2, and 2 m
m
for the six cells in left-to-right, top-to-bottom order.
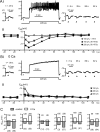
Figure 2.
Activity-dependent shifts in the glycine response. A, An example of negative glycine response shift occurring with prolonged complex spiking. An all-simple-spiking cell with an excitatory glycine response was injected 100 pA at t = 0. Complex spikes began appearing at t = 27 s. The weakly inhibitory effect of glycine at t = 23 s became more inhibitory (t = 105 s) as complex spiking continued. After termination of depolarization, the glycine responses were hyperpolarizing until the fourth response (t = 182), and the return of the excitatory response took ∼100 s (t = 242 s). Arrowheads indicate time of a 500 μ
m
glycine puff, and the horizontal line is drawn at −70 mV for reference. B, Comparison of the change in glycine responses following simple and complex spiking. An all-simple-spiking cell with an inhibitory glycine (2 m
m
) response was silenced with −110 pA bias current and induced to fire late complex spikes (top) or trains of simple spikes (bottom), with an 8 s step of 250 pA and 170 pA, respectively. The horizontal line is aligned to the peaks of glycine responses before the evoked activity. Insets show magnified responses at time points marked “1” and “2.” A positive shift in the glycine response occurred (o) immediately after simple spiking.
Figure 3.
Change in the reversal potential of glycinergic PSPs. A, Glycinergic/GABAergic PSPs were evoked at 0.5 Hz in a cell exhibiting spontaneous bursts of simple spikes. Four segments from a 150-s-long _V_m recording are shown in sequence. Complex spiking was induced after 20 s of control period by 75 pA injection (depol) for 30 s. The PSPs were depolarizing at a _V_m of −79 mV during the pre-depolarization period. Just after the depolarization and complex spiking, PSPs were hyperpolarizing even at −81 mV but became depolarizing at −79 mV again over the next 100 s. PSPs were recorded in the presence of 100 μ
m
APV and 10 μ
m
DNQX. B, Evoked glycinergic/GABAergic PSPs shifting negatively after complex spiking. The bias currents during the pre-depolarization period for cells 1, 2, and 3 were −45, −60, and 0 pA, respectively, and the current was adjusted after depolarization to hold the _V_m close to the pre-depolarization level.
Figure 4.
Ca2+ spiking leads to _E_gly shifts. A, Glycine responses (2 m
m
, marked by arrowheads) shifted negative during a prolonged period of Ca2+ spiking. Spikes were evoked for 42 s by +70 pA from −30 pA bias. A negative shift and recovery in _E_gly was evident as the polarity of glycine responses changed from depolarizing to hyperpolarizing after Ca2+ spiking and back to depolarizing. The hyperpolarization to −80 mV at 2 s into the stimulus was an afterhyperpolarization of the first Ca2+ spike, and the fluctuation of _V_m during 10 s after Ca2+ spiking is thought to be a manifestation of the intrinsic bistability of CWCs. B, Plot of the peak negative (neg) shift in _E_gly versus the number of high-threshold Ca2+ spikes evoked during an 8 s challenge protocol. Dots represent 148 _E_gly series from 83 CWCs. 104 series are from 55 cells recorded with AM dye solution and 44 series from 28 cells without dye. C, The shifts in _E_gly at 2 s after an 8 s Ca2+ spiking (i), complex spiking (ii), or simple spiking (iii) are plotted against the peak negative shift of the _E_gly series. Dots in each plot represent single _E_gly series from different cells, with n = 44, 29, and 8 for i, ii, and iii, respectively. All data were obtained in TTX except for that shown in Cii, iii.
Figure 5.
Ca2+-dependent and -independent change in _E_gly. A, B, Data from one cell comparing glycine responses and _E_gly measurements in control condition (A) with those in zero-Ca2+ (B). Time 0 is the moment the 8 s depolarizing current injection terminated. Ai, After 56 high-threshold Ca2+ spikes induced with a 220 pA injection, the glycine response shifted negative. Aii, The _E_gly series measured along with the _V_m recording in Ai is shown (●) with two other series obtained with different amounts of current injections. The negative _E_gly shifts peaked at 8.5 s. HTSs, High-threshold spikes. Bi, ii, The _V_m and _E_gly series in zero-Ca2+ (replaced with Mg2+) are displayed in the same way as in A. After a depolarization in zero-Ca2+, no negative shift but a positive shift in _E_gly occurred. Bias current was −40 pA in Ai and −55 pA in Bi. C, Bar graphs showing the peak change in _E_gly after an 8 s current injection (amount in pA indicated above each bar) in control condition and in zero-Ca2+ from six cells. The number of Ca2+ spikes evoked is shown in parentheses under each bar belonging to control conditions. All data were obtained in TTX.
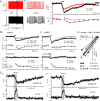
Figure 6.
Ca2+-dependent intracellular acidification. A, Simultaneous monitoring of pHi and _E_gly with respect to 8 s of simple spiking (red) and complex spiking (black) in one cell. Arrowheads indicate glycine (2 m
m
) responses. The pH-sensitive dye SNARF-5F's signal is the average fluorescence intensity of a region of interest drawn inside the cell body. An intracellular acidification, manifested as a decrease in SNARF's signal, occurred during both simple spiking and complex spiking. The black bar above SNARF traces indicates the duration of 8 s depolarizing current injection. B, The intracellular acidification was also seen with Ca2+ spiking (in TTX) and inhibited by zero-Ca2+ (replaced with Co2+ or Mg2+) or 300 μ
m
Cd2+. Bi–ii, Simultaneously recorded SNARF signal and _E_gly from two cells. The 8 s depolarizing current injections evoking Ca2+ spikes or just depolarization after Ca2+ channel block are marked with thick bars above SNARF traces. The amount of injected current is shown beside each symbol along with the number of evoked Ca2+ spikes in parenthesis. An example of complete block (Bi) and incomplete block (Bii) of the depolarization-induced acidification by zero-Ca2+ is shown. Biii, Relation between the change in SNARF signal to the peak negative _E_gly shift in control condition and the peak positive _E_gly shift in Ca2+ block condition for eight cells. C, The changes in pHi and [Ca2+]i induced by 8 s complex spiking were detected by simultaneous two-photon imaging of SNARF-5F and Fluo-4 or Fura-2. Examples from two different cells are shown. The duration of 8 s depolarizing current injection evoking complex spikes is indicated by the shaded rectangle. The excitation wavelengths were 800 nm (Ci) and 780 nm (Cii).
Figure 7.
Activity-independent pHi and _E_gly change and simultaneous Cl and pH imaging. A, Examples showing the concurrent changes in _E_gly (left ordinate) and pHi (right ordinate) induced during and after 20 m
m
sodium propionate (Ai) and 10 m
m
TMA (Aii) perfusion for inducing intracellular acidification and alkalinization, respectively. SNARF images were obtained at 0.5 Hz while cells were held at −75 mV in v-clamp in TTX. B, Simultaneous two-photon imaging of intracellular pH and Cl− with SNARF and MQAE. Excitation wavelength, 750 nm. Bi, Two images of one area taken at the same time through the red emission channel (SNARF) and green channel (MQAE). MQAE was bulk-loaded into DCN slice, and SNARF was loaded from the recording pipette on the left of the cell at the lower left. Inhomogeneous staining with MQAE is typical. Bii, Simultaneous records of pHi (SNARF) and Cl−i (MQAE) obtained from two different cells. An 8 s complex spiking was evoked during the period of gray rectangle with the indicated amount of current. The peak of each signal is indicated with an arrow.
Figure 8.
Block of the negative _E_gly shift by H2DIDS. A, Simultaneously obtained SNARF signal and _E_gly from one cell are shown for control condition (Ai) and in100 μ
m
H2DIDS (Aii) along with the _V_m trace of Ca2+ spiking. Thick bars indicate periods of 8 s Ca2+ spiking. Arrowheads indicate the time of 2 m
m
glycine puff. The number of evoked Ca2+ spikes is shown in parenthesis. The bias currents during the 8 s current injection were −80 pA and −55 pA for i and ii, respectively. B, Another example showing the difference in magnitude and time course of pHi change between the control condition and in H2DIDS. The period of 8 s Ca2+ spiking evoked with 70 pA is bound by a rectangle. Numbers of evoked Ca2+ spikes are shown in parenthesis. The arrow indicates the time of peak acidification in H2DIDS. C, Plot of peak acidification (in SNARF's Δ_F_/F) against the peak negative _E_gly shift in control condition and the peak positive _E_gly shift in H2DIDS. Five cases (pairs) from different cells are shown. The same depolarizing current injection was used for control and H2DIDS conditions in each of the five cases, but the amount ranged from 70 to 300 pA in different cells. The average of peak negative _E_gly shifts in controls is −2.6 ± 1.1 mV, and that of peak positive shifts in H2DIDS is 0.9 ± 0.4 mV for the five cases in the plot.
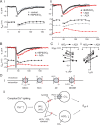
Figure 9.
Block of the negative _E_gly shift by HCO3−/CO2 removal. A, The effect on _E_gly and pHi of removing HCO3−/CO2 from perfusion (HEPES/O2) (i) and then adding AZA (50 μ
m
) (ii) in one cell. Superimposed control–treatment pairs of _E_gly/pHi series were chosen on the basis of similar numbers of evoked Ca2+ spikes during the 8 s depolarization. The periods of 8 s Ca2+ spiking are marked with thick bars. Ai, The injected current and number of evoked Ca2+ spikes were 180 pA/16 and 120 pA/18 Ca2+ spikes for the control and HEPES/O2, respectively. Aii, The injected current and number of evoked Ca2+ spikes were 130 pA/30, 110 pA/31, and 110 pA/15 Ca2+ spikes for HEPES/O2, after AZA addition (+AZA) and 17 min after removing AZA (−AZA), respectively. The effects of AZA were fully reversible if it had been applied for less than ∼15 min. B, Another example showing the slowed pHi recovery and positive _E_gly shift after addition of AZA in HEPES/O2 after Ca2+ spiking. Time of peak acidification in AZA is indicated with an arrow, and the period of Ca2+ spiking is shaded. The injected current and number of evoked Ca2+ spikes were 170 pA/23 and 160 pA/22 Ca2+ spikes for HEPES/O2 and +AZA, respectively. C, Plot of peak acidification (i) and half-recovery time (ii) against the peak negative _E_gly shift and the peak positive _E_gly shift for HEPES/O2 and +AZA for six cases (from different cells) in which the numbers of evoked Ca2+ spikes were similar between the two conditions. The number of evoked Ca2+ spikes in +AZA condition ranged from 20 to 47 in the six cases. The difference in peak acidification was not significant, but the half-recovery time was significantly lengthened in AZA added to HEPES/O2. D, Chloride transporters potentially affecting neuronal [Cl−]i (i), and the proposed mechanism of activity-dependent negative shift in _E_gly in CWCs (ii). KCC, K+-Cl− cotransporters; NKCC, Na+-K+-Cl− cotransporters; AE, Na+-independent anion (Cl−-HCO3−) exchanger; NDCBE, Na+-driven Cl−-HCO3− exchanger, also known as NDAE.
Figure 10.
Detection of NDCBE in the DCN by indirect immunofluorescence. A, A confocal laser-scanned image showing labeling of NDCBE in the DCN. Putative CWCs are concentrated in the middle row of the image, and two of them are labeled with asterisks. Arrows, UBCs. B, Another DCN section processed at the same time with the one in A, but without the primary antibody. Orientation of the DCN section in both A and B is the ependymal surface toward the bottom. C, A piece of cerebellum attached to the brainstem section containing the DCN of A shows labeling. Purkinje cells are marked with asterisks and one UBC is marked with an arrow. Images of cerebellar sections not treated with the primary antibody were as dark as the one in B (data not shown). Scale bar, 20 μm. NDCBE antibody was the 1G10 clone (1:100). Laser and confocal settings were identical in all three micrographs.
Similar articles
- Ion channels generating complex spikes in cartwheel cells of the dorsal cochlear nucleus.
Kim Y, Trussell LO. Kim Y, et al. J Neurophysiol. 2007 Feb;97(2):1705-25. doi: 10.1152/jn.00536.2006. J Neurophysiol. 2007. PMID: 17289937 - Cell-specific, spike timing-dependent plasticities in the dorsal cochlear nucleus.
Tzounopoulos T, Kim Y, Oertel D, Trussell LO. Tzounopoulos T, et al. Nat Neurosci. 2004 Jul;7(7):719-25. doi: 10.1038/nn1272. Epub 2004 Jun 20. Nat Neurosci. 2004. PMID: 15208632 - Rapid, activity-independent turnover of vesicular transmitter content at a mixed glycine/GABA synapse.
Apostolides PF, Trussell LO. Apostolides PF, et al. J Neurosci. 2013 Mar 13;33(11):4768-81. doi: 10.1523/JNEUROSCI.5555-12.2013. J Neurosci. 2013. PMID: 23486948 Free PMC article. - Membrane properties underlying patterns of GABA-dependent action potentials in developing mouse hypothalamic neurons.
Wang YF, Gao XB, van den Pol AN. Wang YF, et al. J Neurophysiol. 2001 Sep;86(3):1252-65. doi: 10.1152/jn.2001.86.3.1252. J Neurophysiol. 2001. PMID: 11535674 - Role of bicarbonate and chloride in GABA- and glycine-induced depolarization and [Ca2+]i rise in fetal rat motoneurons in situ.
Kulik A, Nishimaru H, Ballanyi K. Kulik A, et al. J Neurosci. 2000 Nov 1;20(21):7905-13. doi: 10.1523/JNEUROSCI.20-21-07905.2000. J Neurosci. 2000. PMID: 11050110 Free PMC article.
Cited by
- Optogenetic Visualization of Presynaptic Tonic Inhibition of Cerebellar Parallel Fibers.
Berglund K, Wen L, Dunbar RL, Feng G, Augustine GJ. Berglund K, et al. J Neurosci. 2016 May 25;36(21):5709-23. doi: 10.1523/JNEUROSCI.4366-15.2016. J Neurosci. 2016. PMID: 27225762 Free PMC article. - The divergence, actions, roles, and relatives of sodium-coupled bicarbonate transporters.
Parker MD, Boron WF. Parker MD, et al. Physiol Rev. 2013 Apr;93(2):803-959. doi: 10.1152/physrev.00023.2012. Physiol Rev. 2013. PMID: 23589833 Free PMC article. Review. - Calcium-dependent isoforms of protein kinase C mediate glycine-induced synaptic enhancement at the calyx of Held.
Chu Y, Fioravante D, Thanawala M, Leitges M, Regehr WG. Chu Y, et al. J Neurosci. 2012 Oct 3;32(40):13796-804. doi: 10.1523/JNEUROSCI.2158-12.2012. J Neurosci. 2012. PMID: 23035091 Free PMC article. - Anion transport and GABA signaling.
Hübner CA, Holthoff K. Hübner CA, et al. Front Cell Neurosci. 2013 Oct 24;7:177. doi: 10.3389/fncel.2013.00177. Front Cell Neurosci. 2013. PMID: 24187533 Free PMC article. Review. - Proton-mediated block of Ca2+ channels during multivesicular release regulates short-term plasticity at an auditory hair cell synapse.
Cho S, von Gersdorff H. Cho S, et al. J Neurosci. 2014 Nov 26;34(48):15877-87. doi: 10.1523/JNEUROSCI.2304-14.2014. J Neurosci. 2014. PMID: 25429130 Free PMC article.
References
- Ballanyi K, Kaila K. Activity-evoked changes in intracellular pH. In: Kaila K, Ransom BR, editors. pH and brain function. New York: Wiley; 1998. pp. 291–308.
- Ben-Ari Y, Gaiarsa JL, Tyzio R, Khazipov R. GABA: a pioneer transmitter that excites immature neurons and generates primitive oscillations. Physiol Rev. 2007;87:1215–1284. - PubMed
- Bergeron MJ, Gagnon E, Wallendorff B, Lapointe JY, Isenring P. Ammonium transport and pH regulation by K+-Cl-cotransporters. Am J Physiol Renal Physiol. 2003;285:F68–F78. - PubMed
- Berrebi AS, Mugnaini E. Distribution and targets of the cartwheel cell axon in the dorsal cochlear nucleus of the guinea pig. Anat Embryol (Berl) 1991;183:427–454. - PubMed
Publication types
MeSH terms
Substances
LinkOut - more resources
Full Text Sources
Miscellaneous


