Reactive astrocytes form scar-like perivascular barriers to leukocytes during adaptive immune inflammation of the CNS - PubMed (original) (raw)
Reactive astrocytes form scar-like perivascular barriers to leukocytes during adaptive immune inflammation of the CNS
Rhonda R Voskuhl et al. J Neurosci. 2009.
Abstract
Factors that regulate leukocyte entry and spread through CNS parenchyma during different types of CNS insults are incompletely understood. Reactive astrocytes have been implicated in restricting the spread of leukocytes from damaged into healthy parenchyma during the acute and local innate inflammatory events that follow CNS trauma, but the roles of reactive astrocytes during the chronic and widespread CNS inflammation associated with adaptive or acquired immune responses are uncertain. Here, we investigated the effects of transgenically targeted ablation of proliferating, scar-forming reactive astrocytes on the acquired immune inflammation associated with experimental autoimmune encephalitis (EAE). In wild-type mice with EAE, we found that reactive astrocytes densely surrounded perivascular clusters of leukocytes in a manner reminiscent of astrocyte scar formation after CNS trauma. Transgenically targeted ablation of proliferating astrocytes disrupted formation of these perivascular scars and was associated with a pronounced and significant increase in leukocyte entry into CNS parenchyma, including immunohistochemically identified macrophages, T lymphocytes and neutrophils. This exacerbated inflammation was associated with a substantially more severe and rapidly fulminant clinical course. These findings provide experimental evidence that reactive astrocytes form scar-like perivascular barriers that restrict the influx of leukocytes into CNS parenchyma and protect CNS function during peripherally initiated, acquired immune inflammatory responses in the CNS. The findings suggest that loss or disruption of astrocyte functions may underlie or exacerbate the inflammation and pathologies associated with autoimmune diseases of the CNS, including multiple sclerosis.
Figures
Figure 1.
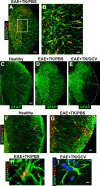
Verification of strategy for transgenic ablation of proliferating astrocytes during EAE. A–I, Single- or two-color immunofluorescence for GFAP (green, A–I) and either transgene derived-TK (red, A–E) or the cell cycle marker, Ki67 (red, F–I) in mouse spinal cord. A, B, Survey and detail images show that in EAE-induced GFAP-TK transgenic mice treated with PBS (EAE+TK/PBS), all TK-expressing cells also express GFAP. Note that TK staining is prominent in astrocyte cell bodies, whereas GFAP is distributed primarily in cell processes. C–E, Survey images of thoracic spinal cord from GFAP-TK mice that were healthy (C) or induced with EAE and given either PBS (D) or GCV (E) to ablate proliferating, transgene-expressing astrocytes (EAE+TK/GCV). Note that GFAP staining is increased in EAE+TK/PBS (D) relative to healthy (C) and reduced in a patchy manner in EAE+TK/GCV (E) relative to EAE+TK/PBS (D), particularly in white matter. F, G, Survey images show that there are few proliferating, Ki67-positive cells in a healthy mouse and that spontaneously proliferating astrocytes (arrow) are rare (F), whereas in a mouse with EAE+TK/PBS, there are many proliferating, Ki67-positive cells, including proliferating astrocytes (arrows) (H). H, I, Detail images show proliferating, Ki67-positive, perivascular astrocytes in a mouse with EAE+TK/PBS (H) and the persistence of surviving, nonproliferating perivascular astrocytes in a mouse with EAE+TK/GCV (I). Scale bars: A, 100 μm; B, 25 μm; C–E, 125 μm; F, G, 50 μm; H, I, 4 μm.
Figure 2.
Exacerbated clinical signs of EAE in mice with transgenically targeted ablation of proliferating reactive astrocytes. Graph showing observer scored clinical rating scale (mean ± SEM) of EAE signs in GFAP-TK transgenic mice that were induced with EAE and given either PBS (EAE+TK/PBS) as a vehicle control, or GCV (EAE+TK/GCV) to ablate transgene-expressing astrocytes, or GFAP-TK mice given GCV but not induced with EAE (Non-EAE+TK/GCV). GFAP-TK mice induced with EAE and given PBS exhibited a moderately severe clinical course that reached a plateau as expected. GFAP-TK mice induced with EAE and given GCV exhibited a rapidly fulminant clinical course that was significantly more severe than that of mice given PBS. GFAP-TK mice given GCV but not induced with EAE exhibited no clinical signs. Data are representative of two separate experiments. ***p < 0.001 relative to EAE+TK/PBS, ANOVA with post hoc pairwise comparisons; n = 7 per group.
Figure 3.
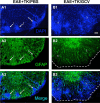
Increased spread of infiltrating inflammatory cells during EAE with ablation of proliferating reactive astrocytes. A1–A3, B1–B3, Single-channel and merged two-color fluorescence survey images of spinal cord sections stained for GFAP (green) and the nuclear counterstain, DAPI (blue), in GFAP-TK transgenic mice that were induced with EAE and given either PBS (EAE+TK/PBS) as a vehicle control (A1–A3), or GCV (EAE+TK/GCV) to ablate transgene-expressing astrocytes (B1–B3). Note that in EAE+TK/PBS, DAPI-stained infiltrating inflammatory cells (A1) are found primarily in dense perivascular clusters (e.g., 1–3) surrounded by intensely stained GFAP-positive astrocytes (A2, A3). Clusters 1 and 2 are shown at higher magnification in Figure 10_A_. In EAE+TK/GCV (B1–B3), inflammation is markedly increased and there is little perivascular clustering in comparison with EAE+TK/PBS (A1–A3); instead, DAPI-stained infiltrating inflammatory cells (B1) spread widely in the parenchyma of the white matter (e.g., 4, 5). GFAP staining shows that the white matter is substantially depleted of GFAP-positive astrocytes in EAE+TK/GCV (B2), and double staining reveals that the spread of DAPI-positive inflammatory cells is heaviest in areas depleted of astrocytes (B3). Region 4 is shown at higher magnification in Figure 10_B_. Scale bar, 50 μm.
Figure 4.
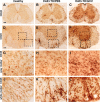
Increased upregulation of CD45-positive inflammatory cells during EAE with ablation of proliferating reactive astrocytes. A–L, Survey and detail bright-field images of lumbar spinal cord sections immunohistochemically stained for the pan leukocyte and microglial marker, CD45 in spinal cord of GFAP-TK mice that were either healthy (A, D, G, J) or had EAE+TK/PBS (B, E, H, K) or EAE+TK/GCV (C, F, I, L). Note the increase in both staining intensity and number of CD45-positive cells in EAE+TK/PBS (B, E, H, K) relative to normal (A, D, G, J), and a further increase in EAE+TK/GCV (C, F, I, L) relative to EAE+TK/PBS (B, E, H, K). Note also the marked increase in large globoid CD45-positive cells with the appearance of leukocytes in EAE+TK/GCV (C, F, I, L) relative to EAE+TK/PBS (B, E, H, K) in both gray (I, H) and white (L, K) matter. Scale bars: A–C, 170 μm; D–F, 90 μm; G–L, 27 μm.
Figure 5.
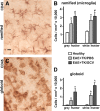
Significantly increased numbers of inflammatory cells in spinal cord during EAE with ablation of proliferating reactive astrocytes. A–D, Qualitative appearance (A, C) and quantitative stereological evaluations (B, D) of CD45-positive inflammatory cells in spinal cord of GFAP-TK mice that were either healthy or had EAE+TK/PBS or EAE+TK/GCV. A, C, Bright-field detail images of immunohistochemically stained CD45-positive cells meeting the criteria of ramified microglia (A) or globoid inflammatory cells (C) for quantitative analysis. B, D, Graphs of quantitative stereological evaluations of density of ramified (B) or globoid (D) CD-45-positive cells in spinal cord gray and white matter show that the densities of both ramified microglia (B) and globoid inflammatory cells (D) were increased significantly in EAE+TK/PBS relative to healthy, and globoid inflammatory cells were further increased significantly in EAE+ TK/GCV relative to EAE+TK/PBS (B, D). *p < 0.01 relative to healthy; #not significant relative to EAE+TK/PBS; ⋀p < 0.01 relative to EAE+TK/PBS; ANOVA with post hoc pairwise comparisons; n = 6 per group. Scale bar, 10 μm.
Figure 6.
Increased upregulation of Iba1-positive microglia and spread of Iba1-positive macrophages during EAE with ablation of proliferating reactive astrocytes. A–I, Survey and detail bright-field images of lumbar spinal cord sections immunohistochemically stained for the microglial cell and macrophage marker, Iba1, in GFAP-TK mice that were either healthy (A, D, G) or had EAE+TK/PBS (B, E, H) or EAE+TK/GCV (C, F, I). Note the increase in both staining intensity and number of Iba1-positive cells in EAE+TK/PBS (B, E, H) relative to healthy (A, D, G), and a further increase in EAE+TK/GCV (C, F, I) relative to EAE+TK/PBS (B, E, H). Note also that globoid Iba1-positive macrophages are primarily in perivascular clusters (pvc) in EAE (B, E, H) and are spread widely in the parenchyma (par) in EAE+TK/GCV (C, F, I). bv, Blood vessel. Scale bars: A–C, 90 μm; D–I, 27 μm.
Figure 7.
Increased infiltration and spread of CD3-positive T lymphocytes during EAE with ablation of proliferating reactive astrocytes. A, B, Survey bright-field images of lumbar spinal cord sections immunohistochemically stained for the T lymphocyte marker, CD3 in mice with EAE+TK/PBS (A) or EAE+TK/GCV (B). Note that in EAE+TK/PBS, CD3-positive T lymphocytes are found primarily in perivascular clusters (pvc, A), whereas in EAE+TK/GCV, CD3-positive T lymphocytes are spread widely in the parenchyma (par) of the white matter and there is little perivascular clustering (B). C, Graph of quantitative stereological evaluations of density of CD3-positive T lymphocytes in spinal cord gray and white matter, showing that CD3 cells were increased significantly in EAE+TK/PBS relative to healthy, and were further increased significantly in EAE+ TK/GCV relative to EAE+TK/PBS in white but not in gray matter. *p < 0.01 relative to healthy; #not significant relative to EAE+TK/PBS, ⋀p < 0.01 relative to EAE+TK/PBS; ANOVA with post hoc pairwise comparisons; n = 3 per group. D, Detail of boxed area in B showing CD3-positive T lymphocytes in white matter parenchyma. bv, Blood vessel. Scale bars: A, B, 20 μm; D, 5 μm.
Figure 8.
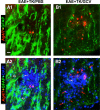
Increased spread of neutrophils during EAE with ablation of proliferating reactive astrocytes. A, B, Detail, merged two- or three-color fluorescence images of spinal cord white matter stained for the neutrophils marker, Ag4/7 (red), GFAP (green), and (DAPI blue) in EAE+TK/PBS (A1, A2) and EAE+TK/GCV (B1, B2). Note that in EAE+TK/PBS, a few positive neutrophils are present but confined to a perivascular cluster of infiltrating inflammatory cells (pvc) surrounded by tightly packed GFAP-positive astrocytes (AS) (A1, A2), whereas in EAE+TK/GCV, Ag4/7-positive neutrophils (red) are increased in number and together with other inflammatory cells (blue) spread widely in the white matter (wm) parenchyma in regions depleted of astrocytes (B1, B2). Scale bar, 35 μm.
Figure 9.
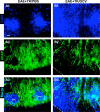
Disruption of perivascular barriers to inflammatory cells during EAE with ablation of proliferating reactive astrocytes. A1–A3, B1–B3, Detail, single-channel and merged two-color fluorescence images of spinal cord sections stained for GFAP (green) and the nuclear counterstain, DAPI (blue), in EAE+TK/PBS (A1–A3) and EAE+TK/GCV (B1–B3). A1–A3, Detail images of perivascular inflammatory cell clusters 1 and 2 from Figure 3_A_. B1–B3, Detail images of region 4 from Figure 3_B_. Note that in EAE+TK/PBS, dense clusters of DAPI-stained infiltrating inflammatory cells (A1) are surrounded by tightly packed GFAP-positive astrocytes (A2, A3), whereas in EAE+TK/GCV, DAPI-stained inflammatory cells spread widely in the parenchyma of the white matter (B1) and this spread is heaviest in areas most depleted of astrocytes (B2, B3). Scale bar, 20 μm.
Figure 10.
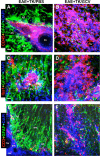
Perivascular astrocyte barriers restrain the spread of extravasting CD45-positive leukocytes, Iba1-positive macrophages, and CD3-positive T lymphocytes during EAE. A–F, Detail, merged three-color fluorescence images of spinal cord white matter stained for GFAP (green) and (DAPI blue) in combination with either the pan leukocyte marker, CD45 (red, A, B), the macrophage marker, Iba1 (red, C, D), or the T lymphocyte marker, CD3 (red, E, F), in mice with EAE+TK/PBS (A, C, E) or EAE+TK/GCV (B, D, F). Note that in EAE+TK/PBS, CD45-positive leukocytes, Iba1-positive globoid macrophages, and CD3-positive T lymphocytes are largely confined to perivascular clusters of extravasting inflammatory cells (pvc) surrounded by tightly packed GFAP-positive astrocytes (AS) (A, C, E), whereas in EAE+TK/GCV, all of these inflammatory cell types spread widely in the white matter (wm) parenchyma in regions depleted of astrocytes (B, D, F). bv, Blood vessel. Scale bars: A, B, 27 μm; C, D, 15 μm; E, F, 35 μm.
Figure 11.
Substantial demyelination in EAE with ablation of proliferating reactive astrocytes. A–F, Survey images of dorsal columns of thoracic spinal cord of GFAP-TK mice that were either healthy (A, D) or had EAE+TK/PBS (B, E) or EAE+TK/GCV (C, F). Sections were stained either with the myelin stain Luxol fast blue (LFB, A–C), or with single-color immunofluorescence for myelin basic protein (MBP, red, D–F). Note that there is reduced staining for both LFB and MBP due to demyelination in EAE+TK/PBS (B, E) relative to healthy (A, D), and that the demyelination is as severe or worse in EAE+TK/GCV (C, F) relative to EAE+TK/PBS (B, E). Scale bars, 80 μm.
Figure 12.
Severe axonal pathology in EAE with ablation of proliferating reactive astrocytes. A–C, Single-color or merged confocal microscopic images of two-color immunofluorescence for the axonal marker, neurofilament 200 (NF200, green), and amyloid precursor protein (APP, red) in thoracic spinal cord dorsal column white matter of healthy mice (A1–A3) and in mice with EAE+TK/PBS (B1–B3) or EAE+TK/GCV (C1–C3). Note that mice with EAE+TK/PBS exhibit reduce staining of NF200 and increased staining of APP (B1–B3) relative to healthy mice (A1–A3), and that these axon pathologies are as severe or worse in mice with EAE+TK/GCV (C1–C3) relative to EAE+TK/PBS (B1–B3). D, Graph of quantitative evaluations of total number of NF200-positive axons (i.e., cross-sectional axonal profiles) in midthoracic dorsal columns of healthy mice and mice with EAE+TK/PBS or EAE+TK/GCV, showing that axon number was significantly reduced in EAE+TK/PBS relative to healthy and was further reduced significantly in EAE+TK/GCV relative to EAE+TK/PBS. *p < 0.01 relative to healthy; ⋀p < 0.01 relative to EAE+TK/PBS; ANOVA with post hoc pairwise comparisons; n = 6 per group. Scale bar, 10 μm.
Figure 13.
Schematic summary of perivascular barrier functions of proliferating reactive astrocytes during autoimmune-mediated leukocyte infiltration in the CNS. A, In EAE, reactive astrocytes and their processes densely surround perivascular clusters of extravasated immune and inflammatory leukocytes in a manner reminiscent of scar formation after CNS injury; and there is limited spread of inflammatory leukocytes into the neighboring CNS parenchyma. B, In EAE combined with transgenically targeted ablation of proliferating scar-forming reactive astrocytes, there is a failure of astrocytes to surround leukocytes in the perivascular region and this failure is accompanied by widespread infiltration of inflammatory leukocytes (including macrophages, T lymphocytes, and neutrophils) throughout the CNS parenchyma. Together, these observations argue that perivascular reactive astrocytes are exerting an essential scar-like barrier function that restricts infiltrating leukocytes to the perivascular space and limits their spread into nearby healthy CNS parenchyma. This process provides a cellular mechanism underlying the common neuropathological observation of perivascular clustering or “cuffing” of inflammatory leukocytes. The loss or attenuation of this scar-like perivascular barrier function of reactive astrocytes has the potential to exacerbate the spread of parenchymal spread of inflammation in various CNS disorders.
Similar articles
- Glial scar borders are formed by newly proliferated, elongated astrocytes that interact to corral inflammatory and fibrotic cells via STAT3-dependent mechanisms after spinal cord injury.
Wanner IB, Anderson MA, Song B, Levine J, Fernandez A, Gray-Thompson Z, Ao Y, Sofroniew MV. Wanner IB, et al. J Neurosci. 2013 Jul 31;33(31):12870-86. doi: 10.1523/JNEUROSCI.2121-13.2013. J Neurosci. 2013. PMID: 23904622 Free PMC article. - Astrocytes play a key role in EAE pathophysiology by orchestrating in the CNS the inflammatory response of resident and peripheral immune cells and by suppressing remyelination.
Brambilla R, Morton PD, Ashbaugh JJ, Karmally S, Lambertsen KL, Bethea JR. Brambilla R, et al. Glia. 2014 Mar;62(3):452-67. doi: 10.1002/glia.22616. Epub 2013 Dec 19. Glia. 2014. PMID: 24357067 - Gp130-dependent astrocytic survival is critical for the control of autoimmune central nervous system inflammation.
Haroon F, Drögemüller K, Händel U, Brunn A, Reinhold D, Nishanth G, Mueller W, Trautwein C, Ernst M, Deckert M, Schlüter D. Haroon F, et al. J Immunol. 2011 Jun 1;186(11):6521-31. doi: 10.4049/jimmunol.1001135. Epub 2011 Apr 22. J Immunol. 2011. PMID: 21515788 - Glial influences on BBB functions and molecular players in immune cell trafficking.
Lécuyer MA, Kebir H, Prat A. Lécuyer MA, et al. Biochim Biophys Acta. 2016 Mar;1862(3):472-82. doi: 10.1016/j.bbadis.2015.10.004. Epub 2015 Oct 8. Biochim Biophys Acta. 2016. PMID: 26454208 Review. - Astrocytes in multiple sclerosis and experimental autoimmune encephalomyelitis: Star-shaped cells illuminating the darkness of CNS autoimmunity.
Yi W, Schlüter D, Wang X. Yi W, et al. Brain Behav Immun. 2019 Aug;80:10-24. doi: 10.1016/j.bbi.2019.05.029. Epub 2019 May 21. Brain Behav Immun. 2019. PMID: 31125711 Review.
Cited by
- The Role of Inflammatory Cascade and Reactive Astrogliosis in Glial Scar Formation Post-spinal Cord Injury.
Bhatt M, Sharma M, Das B. Bhatt M, et al. Cell Mol Neurobiol. 2024 Nov 23;44(1):78. doi: 10.1007/s10571-024-01519-9. Cell Mol Neurobiol. 2024. PMID: 39579235 Free PMC article. Review. - Inflammatory aspects of Alzheimer's disease.
Botella Lucena P, Heneka MT. Botella Lucena P, et al. Acta Neuropathol. 2024 Aug 28;148(1):31. doi: 10.1007/s00401-024-02790-2. Acta Neuropathol. 2024. PMID: 39196440 Review. - Dissecting glial scar formation by spatial point pattern and topological data analysis.
Manrique-Castano D, Bhaskar D, ElAli A. Manrique-Castano D, et al. Sci Rep. 2024 Aug 16;14(1):19035. doi: 10.1038/s41598-024-69426-z. Sci Rep. 2024. PMID: 39152163 Free PMC article. - Nerve-Glial antigen 2: unmasking the enigmatic cellular identity in the central nervous system.
Bottero M, Pessina G, Bason C, Vigo T, Uccelli A, Ferrara G. Bottero M, et al. Front Immunol. 2024 Jul 29;15:1393842. doi: 10.3389/fimmu.2024.1393842. eCollection 2024. Front Immunol. 2024. PMID: 39136008 Free PMC article. Review. - Systemic inflammation attenuates the repair of damaged brains through reduced phagocytic activity of monocytes infiltrating the brain.
Gaire S, An J, Yang H, Lee KA, Dumre M, Lee EJ, Park SM, Joe EH. Gaire S, et al. Mol Brain. 2024 Jul 29;17(1):47. doi: 10.1186/s13041-024-01116-3. Mol Brain. 2024. PMID: 39075534 Free PMC article.
References
- Adams CW, Poston RN, Buk SJ. Pathology, histochemistry and immunocytochemistry of lesions in acute multiple sclerosis. J Neurol Sci. 1989;92:291–306. - PubMed
- Ahmed Z, Shaw G, Sharma VP, Yang C, McGowan E, Dickson DW. Actin-binding proteins coronin-1a and IBA-1 are effective microglial markers for immunohistochemistry. J Histochem Cytochem. 2007;55:687–700. - PubMed
- Aloisi F, Penna G, Cerase J, Menéndez Iglesias B, Adorini L. IL-12 production by central nervous system microglia is inhibited by astrocytes. J Immunol. 1997;159:1604–1612. - PubMed
- Borrelli E, Heyman RA, Arias C, Sawchenko PE, Evans RM. Transgenic mice with inducible dwarfism. Nature. 1989;339:538–541. - PubMed
- Brambilla R, Persaud T, Hu X, Karmally S, Shestopalov VI, Dvoriantchikova G, Ivanov D, Nathanson L, Barnum SR, Bethea JR. Transgenic inhibition of astroglial NF-kappaB improves functional outcome in experimental autoimmune encephalomyelitis by suppressing chronic central nervous system inflammation. J Immunol. 2009;182:2628–2640. - PMC - PubMed
Publication types
MeSH terms
Substances
Grants and funding
- R01 NS057624-01A2/NS/NINDS NIH HHS/United States
- NS057624/NS/NINDS NIH HHS/United States
- K24 NS062117-01/NS/NINDS NIH HHS/United States
- R21 NS042693-02/NS/NINDS NIH HHS/United States
- R01 NS057624/NS/NINDS NIH HHS/United States
- K24 NS062117/NS/NINDS NIH HHS/United States
- R21 NS042693/NS/NINDS NIH HHS/United States
- R01 NS057624-02/NS/NINDS NIH HHS/United States
LinkOut - more resources
Full Text Sources
Other Literature Sources
Medical
