E2F1 mediates DNA damage and apoptosis through HCF-1 and the MLL family of histone methyltransferases - PubMed (original) (raw)
E2F1 mediates DNA damage and apoptosis through HCF-1 and the MLL family of histone methyltransferases
Shweta Tyagi et al. EMBO J. 2009.
Abstract
E2F1 is a key positive regulator of human cell proliferation and its activity is altered in essentially all human cancers. Deregulation of E2F1 leads to oncogenic DNA damage and anti-oncogenic apoptosis. The molecular mechanisms by which E2F1 mediates these two processes are poorly understood but are important for understanding cancer progression. During the G1-to-S phase transition, E2F1 associates through a short DHQY sequence with the cell-cycle regulator HCF-1 together with the mixed-lineage leukaemia (MLL) family of histone H3 lysine 4 (H3K4) methyltransferases. We show here that the DHQY HCF-1-binding sequence permits E2F1 to stimulate both DNA damage and apoptosis, and that HCF-1 and the MLL family of H3K4 methyltransferases have important functions in these processes. Thus, HCF-1 has a broader role in E2F1 function than appreciated earlier. Indeed, sequence changes in the E2F1 HCF-1-binding site can modulate both up and down the ability of E2F1 to induce apoptosis indicating that HCF-1 association with E2F1 is a regulator of E2F1-induced apoptosis.
Figures
Figure 1
Schematic structure of E2F1 protein showing conserved
H
CF-1-
b
inding
m
otif (HBM) and
C
yclin-
b
inding
m
otif (CBM) sequences and E2F1 mutants used in this study. (Top) Amino-acid sequence alignment of E2F1 HBM regions from the species listed are adapted from Tyagi et al (2007). Dots indicate identity with the human sequence. //denotes amino acids 53–99 of Drosophila E2F1. LZ, Leucine zipper; MB, marked box. (Bottom) Alanine substitutions made in the E2F1 CBM (E2F1CBMmut) or HBM (E2F1HBMmut) are shown. E2F1VP16HBM replacement of the E2F1 HBM and surrounding sequence by corresponding HSV-1 VP16 sequences.
Figure 2
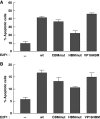
Alterations in the E2F1 HCF-1-binding site can modulate induction of apoptosis. (A) Anti-E2F1 and β-actin immunoblot analysis from U2OS-cell extracts transfected with empty plasmid (lane 1) or plasmids encoding E2F1 (lane 2) or indicated E2F1 mutants (lanes 3–5) and harvested 40-h post-transfection. (B) Nuclear extracts of U2OS cells transfected as in (A) were prepared, immunoprecipitated with anti-HCF-1 antisera (bottom panel), and recovered E2F1 proteins were visualized by immunoblot with anti-E2F1antisera. Input (top panel) corresponds to 10% of the nuclear extract used for the immunoprecipitation. (C) U2OS cells were transfected as in (A), stained with propidium iodide, and analysed for DNA content by flow cytometry. Apoptosis was measured by the sub-G1 DNA content (<2N) population. 2N, G1-phase cells; 4N, G2/M-phase cells. (D) Transfected cells were analysed for the apoptotic sub-G1 DNA content cell population as in (C) and the averaged data are derived from three independent experiments. (E) Quantification of cells transfected as in (A), and scored positive for TdT-mediated dUTP nick end-labelling (TUNEL) assay. The percentage was determined by counting 200 cells per sample in each of two different experiments. Data are represented as mean±s.d.
Figure 3
E2F1 HCF-1-binding site supports induction of apoptosis in MCF7 and IMR-90tert cells. (A, B) Cells, MCF7 (A) or IMR-90tert (B), were transfected as in Figure 2A, stained with propidium iodide, and analysed for DNA content by flow cytometry. Apoptosis was measured by the sub-G1 DNA content (<2N) population and the averaged data are derived from two independent experiments.
Figure 4
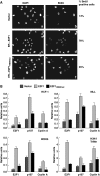
The E2F1 HCF-1-binding site contributes to DNA-damage induction. (A, C) Immunoflourescence analysis of U2OS cells stably expressing ER–E2F1 or ER–E2F1HBMmut with or without OHT induction and stained with anti-53BP1 (A) or anti-RPA70 (C) shown with or without the result of DAPI co-staining. Scale bar represents 10 μm (A) or 40 μm (C). Arrowheads in (C) point to cells considered positive for RPA foci. (B, D) Quantification of cells positive for 53BP1-foci (B) or RPA-foci (D) after induction with OHT for the indicated times. The percentage was determined by counting 200 cells per sample in each of the two different experiments. Data are represented as mean±s.d.
Figure 5
E2F1HBMmut is defective for S-phase activation. (A) Long-term BrdU incorporation assay of E2F1 siRNA-treated cells stably expressing vector alone, ER–E2F1, or ER–E2F1HBMmut. The cells were harvested 72 h after the first siRNA transfection (with 24 h OHT induction) and stained with DAPI or anti-BrdU antibody. Arrowheads identify cells that lack BrdU incorporation. Percentage of BrdU positive cells was determined by counting 200 cells per sample. A second experiment yielded similar relative values. (B) Quantitation of HCF-1, MLL, WDR5, and H3K4 trimethylation (TriMe) ChIP analyses of U2OS cells transfected with plasmids encoding empty vector, E2F1, or E2F1HBMmut, by triplicate real-time PCR of the indicated promoters is shown. The cells were harvested 24 h post-transfection. The signals in cells immunoprecipitated using the anti-E2F1 antibody are set to 1 for each transfected sample with all other signals in that transfected sample indicated as relative-fold differences (relative units).
Figure 6
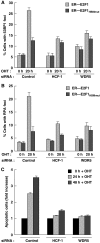
HCF-1 and the WDR5 component of the MLL family of H3K4 methytransferases are required for E2F1-mediated apoptosis induction. (A, B) ER–E2F1 or ER–E2F1HBMmut U2OS cells were treated with HCF-1 or WDR5 siRNAs for 72 h and quantified for 53BP1- (A) or RPA- (B) foci positive cells after induction with OHT for 0 or 20 h. The percentage was determined by counting 200 cells per sample in each of two different experiments. Data are represented as mean±s.d. (C) Apoptosis measurement of ER—E2F1 U2OS cells treated with HCF-1 or WDR5 siRNAs and induced with OHT for 24 or 48 h. Apoptosis, as measured by cells with a sub-G1 DNA content, was determined by flow cytometry. Apoptotic cell population at 0 h induction with OHT in each siRNA treatment was set to 1 with all other signals in that siRNA treatment indicated as relative-fold changes. The schematics and raw data for this experiment are shown in Supplementary Figure S3C.
Figure 7
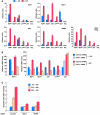
HCF-1 regulates the transcriptional activation of pro-apoptotic E2F-target promoters and apoptosis after DNA-damage induction. (A) ChIP analyses of U2OS cells treated with or without adriamycin (Adr, 2 μg/ml) for 16 h using the indicated antisera (top right corner of each panel) and probed by Q-PCR for the indicated promoters are shown. PCR quantification was done using Delta Relative CT Quantification, where the values are calculated relative to input as follows: Delta CT=CT (input)−CT (sample); Relative Unit=2Delta CT. 0.3% of total ChIP input DNA was used in the input amplification. Triplicate real-time PCR data are represented as mean±s.d. A second experiment yielded similar results. (B) Quantitative real-time RT–PCR, in triplicate, was used to measure relative mRNA levels of indicated transcripts in cells treated with control or HCF-1 siRNA followed by treatment with or without adriamycin (16 h). Cells were harvested 48 h after the first siRNA transfection. (C) Apoptosis measurement of U2OS cells treated with HCF-1 or WDR5 siRNAs followed by treatment with adriamycin (5 μg/ml) for 24 or 48 h. Apoptosis, as measured by cells with a sub-G1 DNA content, was determined by flow cytometry. The apoptotic cell population at 0 h adriamycin treatment in each different siRNA sample was set to 1 with all other signals in that siRNA treatment indicated as relative-fold changes. The raw data for this experiment are shown in Supplementary Figure S4C.
References
- Bartek J, Bartkova J, Lukas J (2007) DNA damage signalling guards against activated oncogenes and tumour progression. Oncogene 26: 7773–7779 - PubMed
- Bartkova J, Horejsí Z, Koed K, Krämer A, Tort F, Zieger K, Guldberg P, Sehested M, Nesland JM, Lukas C, Ørntoft T, Lukas J, Bartek J (2005) DNA damage response as a candidate anti-cancer barrier in early human tumorigenesis. Nature 434: 864–870 - PubMed
- Bartkova J, Rezaei N, Liontos M, Karakaidos P, Kletsas D, Issaeva N, Vassiliou LV, Kolettas E, Niforou K, Zoumpourlis VC, Takaoka M, Nakagawa H, Tort F, Fugger K, Johansson F, Sehested M, Andersen CL, Dyrskjot L, Ørntoft T, Lukas J et al. (2006) Oncogene-induced senescence is part of the tumorigenesis barrier imposed by DNA damage checkpoints. Nature 444: 633–637 - PubMed
- Bates S, Phillips AC, Clark PA, Stott F, Peters G, Ludwig RL, Vousden KH (1998) p14ARF links the tumour suppressors RB and p53. Nature 395: 124–125 - PubMed
Publication types
MeSH terms
Substances
LinkOut - more resources
Full Text Sources


