ATM and Artemis promote homologous recombination of radiation-induced DNA double-strand breaks in G2 - PubMed (original) (raw)
ATM and Artemis promote homologous recombination of radiation-induced DNA double-strand breaks in G2
Andrea Beucher et al. EMBO J. 2009.
Abstract
Homologous recombination (HR) and non-homologous end joining (NHEJ) represent distinct pathways for repairing DNA double-strand breaks (DSBs). Previous work implicated Artemis and ATM in an NHEJ-dependent process, which repairs a defined subset of radiation-induced DSBs in G1-phase. Here, we show that in G2, as in G1, NHEJ represents the major DSB-repair pathway whereas HR is only essential for repair of approximately 15% of X- or gamma-ray-induced DSBs. In addition to requiring the known HR proteins, Brca2, Rad51 and Rad54, repair of radiation-induced DSBs by HR in G2 also involves Artemis and ATM suggesting that they promote NHEJ during G1 but HR during G2. The dependency for ATM for repair is relieved by depleting KAP-1, providing evidence that HR in G2 repairs heterochromatin-associated DSBs. Although not core HR proteins, ATM and Artemis are required for efficient formation of single-stranded DNA and Rad51 foci at radiation-induced DSBs in G2 with Artemis function requiring its endonuclease activity. We suggest that Artemis endonuclease removes lesions or secondary structures, which inhibit end resection and preclude the completion of HR or NHEJ.
Conflict of interest statement
The authors declare that they have no conflict of interest.
Figures
Figure 1
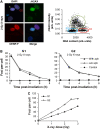
(A) Identification of cell-cycle phases in human fibroblasts (HSF1). Cells were scanned under the microscope and the γH2AX signal was plotted against the DAPI signal. S-phase cells exhibited an intermediate DAPI signal, a weak CENP-F signal and a high pan-nuclear γH2AX signal due to aphidicolin treatment. G1- and G2-phase cells were distinguished from S-phase cells by their dotted instead of a pan-nuclear γH2AX signal. G1 and G2 cells were distinguished from each other either by DAPI content (low in G1 versus high in G2) or by CENP-F staining (absent in G1 versus strong pan-nuclear in G2). Mitotic cells exhibited CENP-F staining and condensed chromatin (Deckbar et al, 2007), and were excluded from the analysis. (B) DSB repair in G1- and G2-phase HSF1 cells is unaffected by aphidicolin treatment and aphidicolin itself (designated ‘control' in the figure) does not induce γH2AX foci. (C) γH2AX foci formation in HSF1 cells at 15 min post IR is linear with dose in G1 and G2 up to approximately 80 foci per cell. G2 cells exhibit about twice the number of DSBs as G1 cells, consistent with their two-fold higher DNA content (NB: The number of DSBs observed in G2 phase at later times (e.g. 8 h) is routinely higher than twice the number in G1-phase since the slow component of DSB repair in G2 is slower than in G1). Error bars in panels B and C represent the s.e.m. from analysis of at least 40 cells.
Figure 2
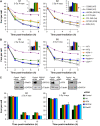
(A) γH2AX foci analysis in primary human fibroblasts. Background foci numbers in primary human fibroblasts were about 2 in G2 and 0.2 in G1, and were subtracted from the foci numbers in the irradiated samples. (B) γH2AX foci analysis in MEFs. Background foci numbers in MEFs were about 2–4 in G2 and 0.5–2 in G1, and were subtracted from the foci numbers in the irradiated samples. The insets magnify the 8-h data for WT, Brca2-; Rad54-, Artemis- and ATM-deficient cells. Statistical analysis was performed at the 6- and 8-h time points, and revealed that Artemis- and ATM-deficient cells in G1 and G2, and Brca2- and Rad54-deficient cells in G2 exhibit significantly elevated foci levels compared with WT cells (P<0.05; one-tailed Welch's test). (C) γH2AX foci analysis in siRNA-treated HeLa cells analysed 48 h after transfection. Efficient knockdown to protein levels <20% was confirmed for all tested siRNAs by Western blotting. Background foci numbers in HeLa cells were about 2–4 in G2 and 0.5–2 in G1, and were subtracted from the foci numbers in the irradiated samples. The number of induced foci measured at 15 min post-IR was similar for all siRNA conditions (data not shown). Samples were evaluated in a blinded manner. Statistical analysis was performed and revealed that cells depleted for Artemis or ATM in G1 and G2, and for Brca2 and Rad51 in G2 exhibit significantly elevated foci levels compared with control siRNA-treated cells at the 8- and 10-h time points (P<0.05; one-tailed Welch's test). Although the repair defect is apparent and similar for the different cell systems, the absolute foci numbers in HeLa cells are higher, likely due to their higher DNA content. Error bars in panels A–C represent the s.e.m. from at least three different experiments.
Figure 3
HR repair sites were visualized by incorporation of BrdU during repair synthesis. HeLa cells were irradiated with 4 Gy and BrdU was added for the entire repair time—BrdU foci were observed after denaturing conditions in G2- but not in G1-phase cells. S-phase cells were identified by pan-nuclear γH2AX or BrdU staining and excluded from the analysis. The image on the left shows control cells analysed 8 h following 4-Gy irradiation treatment. Efficient knockdown to protein levels <25% was confirmed by Western blotting and γH2AX foci analysis (Supplementary Figure 3). Error bars represent the s.e.m. from the analysis of three different experiments (two experiments for Ku80 and Lig4 siRNA).
Figure 4
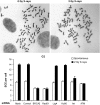
SCEs are detected in G2-irradiated HeLa cells. Cells were grown for two cell cycles (48 h) in BrdU-containing medium and aphidicolin was added immediately prior to irradiation with 2 Gy. Colcemid was then added at 8 h post-IR and the samples were harvested at 12 h post-IR. Irradiation was performed 48 h after siRNA transfection. Samples designated ‘mock' were treated with transfection reagents, but no siRNA was added. SCE numbers were normalized to 70 chromosomes to account for the variability in chromosome number between metaphases. At least 100 metaphases from at least three different experiments were analysed. Error bars represent the s.e.m. from all analysed metaphases.
Figure 5
ssDNA formation is compromised in ATM/Artemis-deficient cells. (A) Analysis of RPA and Rad51 foci formation in primary human fibroblasts. (B) Analysis of Rad51 foci formation in siRNA-treated HeLa cells. (C) Analysis of ssDNA by measuring BrdU foci in siRNA-treated HeLa cells. Cells were labelled with BrdU for 24 h prior to irradiation and foci were observed after non-denaturing conditions. Error bars represent the s.e.m. from the analysis of at least three different experiments.
Figure 6
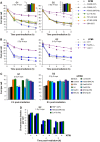
(A) γH2AX foci in primary human fibroblasts in the presence or absence of the ATM inhibitor, KU55933 (designated ATMi in the figure). The insets magnify the 8-h data for WT, Brca2-; Artemis- and ATM-deficient cells treated with KU55933. (B) γH2AX foci analysis in MEFs in the presence or absence of KU55933. Statistical analysis was performed at the 6- and 8-h time points, and revealed that XLF- and Lig4-deficient cells treated with KU55933 exhibit significantly elevated foci levels compared with untreated XLF- and Lig4-deficient cells in G2 but not in G1 (P<0.05; one-tailed Welch's test). (C) γH2AX foci analysis in siRNA-treated HeLa cells. Samples were evaluated in a blinded manner. Statistical analysis was performed and revealed that cells depleted for Artemis, ATM, Control/Artemis, Rad51/Artemis, Rad51/ATM, Brca2/Artemis and Brca2/ATM in G1 and G2, and Rad51-, Brca2- and Rad51/Brca2-depleted cells in G2 exhibit significantly elevated foci levels compared with control siRNA- and mock-treated cells (P<0.05; one-tailed Welch's test). Samples designated ‘mock' were treated with transfection reagents, but no siRNA was added. The experiments for panels A–C were carried out as for Figure 2. Error bars represent the s.e.m. from at least three different experiments. (D) Analysis of G2 PCC chromosomal breaks in calyculin A-treated primary human fibroblasts in the presence of aphidicolin and in the presence or absence of KU55933. Breaks in un-irradiated samples were less than 0.2 and were subtracted from the breaks in the irradiated samples. Error bars represent the s.e.m. from at least 100 cells. Statistical analysis revealed that Brca2- and Artemis-deficient cells with and without KU55933 exhibit significantly more PCC breaks than WT cells without KU55933 at 4 and 6 h (P<0.05; one-tailed Welch's test).
Figure 7
(A) γH2AX foci analysis in primary human fibroblasts in the presence or absence of the DNA-PK inhibitor, NU7026 (designated DNA-PKi in the figure). The analysis was carried out as for Figure 2A. Statistical analysis was performed at the 6- and 8-h time points, and revealed that Artemis- and Brca2-deficient cells with NU7026 exhibit significantly elevated foci levels compared with WT cells with NU7026 in G2 but not in G1 (P<0.05; one-tailed Welch's test). (B) γH2AX foci analysis at prolonged times after IR. Using an approach, which circumvents aphidicolin treatment, cells were pulse-labelled with BrdU for 1 h and irradiated with 9 Gy 4 h after labelling (when in G2). Due to the higher dose, the majority of irradiated G2 cells remained in G2 for at least 96 h (Supplementary Figure 7A). Foci were analysed in BrdU-positive cells and taken to represent G2 cells. The few BrdU-positive cells that had progressed from G2 into G1 during repair incubation were excluded from the analysis based on their lower DAPI signal compared with that of G2 cells. Data for G0 cells were obtained in parallel experiments from the analysis of confluent cultures. Results similar to G0 were obtained for G1 from the analysis of BrdU-negative cells (representing mainly G1 cells) in the same samples that were analysed for the G2 data (Supplementary Figure 7B). The continuing activity of NU7026 over 96 h was confirmed in control experiments (Supplementary Figure 7C). Error bars represent the s.e.m. from the analysis of at least three different experiments.
Figure 8
Artemis endonuclease activity promotes IR-induced HR in G2. The DSB-repair defect of Artemis-deficient cells (CJ179) is corrected with WT Artemis but not with an endonuclease-deficient Artemis construct (D37N), and overexpression of D37N confers a repair defect to HSF1 control cells. Analysis of γH2AX and Rad51 foci was conducted in cells positive for c-myc, that is, only cells efficiently transfected were included in the analysis. The image on the left shows two G2-phase, Artemis-deficient cells transfected with the WT Artemis construct at 8 h following 2-Gy irradiation. One of the two cells shows efficient Artemis expression (c-myc signal) and lower foci numbers. Error bars represent the s.e.m. from three different experiments. Statistical analysis revealed that Artemis-deficient cells with or without complementation of the Artemis D37N construct exhibit significantly elevated γH2AX foci levels (at 6 and 8 h) and significantly reduced Rad51 foci levels (at 2 h) compared with Artemis-deficient cells complemented with the Artemis WT construct (P<0.05; one-tailed Welch's test). Control cells overexpressing D37N-mutant Artemis exhibit significantly elevated γH2AX foci levels (at 6 and 8 h) and significantly reduced Rad51 foci levels (at 2 h) compared with control cells with or without overexpression of Artemis WT (P<0.05; one-tailed Welch's test). See Supplementary data for further information.
Figure 9
IR-induced HR in G2 repairs DSBs in KAP-1-associated heterochromatic DNA regions. (A) Quantification of % of KAP-1 in densely staining DAPI regions in G1- versus G2-phase and localization of γH2AX foci (assessed at 8 h following 2-Gy irradiation in NIH 3T3 mouse cells treated with the ATM inhibitor KU55933) and RPA foci (assessed at 2 h following 2-Gy irradiation in untreated NIH 3T3 cells). KAP-1 signal distribution was estimated by measuring the signal intensity within (i) densely staining DAPI regions and (ii) the total nuclear volume. By dividing (i) by (ii), the percentage of total KAP-1 localized to densely staining DAPI was calculated. In G2-phase, the values estimated were similar to that for the % DAPI staining, suggesting a random distribution of KAP-1, which was not the case in G1-phase where >70% of total KAP-1 was localized to densely staining DAPI, equivalent to <20% of the nuclear volume. Typical images analysed are shown in Supplementary Figure 8. The colocalization studies as well as the KAP-1 staining were performed according to Goodarzi et al (2008). (B) γH2AX foci analysis in 1BRneo cells downregulated for KAP-1 with or without the ATM inhibitor KU55933 (designated ATMi in the figure). (C) γH2AX foci analysis in siRNA-treated HeLa cells. Background foci numbers were subtracted from the foci numbers in the irradiated samples. Samples were evaluated in a blinded manner. Error bars represent the s.e.m. from the analysis of at least three different experiments. Statistical analysis was performed at the 8- and 10-h time points, and revealed that cells treated with control siRNA and KU55933 exhibit significantly elevated foci levels compared with cells treated with KAP-1 siRNA and KU55933. Further, cells treated with ATM siRNA exhibit significantly elevated foci levels compared with cells treated with ATM/KAP-1 double siRNA (P<0.05; one-tailed Welch's test). Although the repair defect is apparent and similar for the two different cell systems, the absolute foci numbers in HeLa cells are slightly higher, likely due to their higher DNA content.
Figure 10
Pathways of DSB repair during the mammalian cell cycle (see text for explanation).
Similar articles
- The influence of heterochromatin on DNA double strand break repair: Getting the strong, silent type to relax.
Goodarzi AA, Jeggo P, Lobrich M. Goodarzi AA, et al. DNA Repair (Amst). 2010 Dec 10;9(12):1273-82. doi: 10.1016/j.dnarep.2010.09.013. Epub 2010 Oct 30. DNA Repair (Amst). 2010. PMID: 21036673 Review. - Radiation-induced double-strand breaks require ATM but not Artemis for homologous recombination during S-phase.
Köcher S, Rieckmann T, Rohaly G, Mansour WY, Dikomey E, Dornreiter I, Dahm-Daphi J. Köcher S, et al. Nucleic Acids Res. 2012 Sep 1;40(17):8336-47. doi: 10.1093/nar/gks604. Epub 2012 Jun 22. Nucleic Acids Res. 2012. PMID: 22730303 Free PMC article. - DNA Double-Strand Break Resection Occurs during Non-homologous End Joining in G1 but Is Distinct from Resection during Homologous Recombination.
Biehs R, Steinlage M, Barton O, Juhász S, Künzel J, Spies J, Shibata A, Jeggo PA, Löbrich M. Biehs R, et al. Mol Cell. 2017 Feb 16;65(4):671-684.e5. doi: 10.1016/j.molcel.2016.12.016. Epub 2017 Jan 26. Mol Cell. 2017. PMID: 28132842 Free PMC article. - The impact of heterochromatin on DSB repair.
Goodarzi AA, Noon AT, Jeggo PA. Goodarzi AA, et al. Biochem Soc Trans. 2009 Jun;37(Pt 3):569-76. doi: 10.1042/BST0370569. Biochem Soc Trans. 2009. PMID: 19442252 - Roles for 53BP1 in the repair of radiation-induced DNA double strand breaks.
Shibata A, Jeggo PA. Shibata A, et al. DNA Repair (Amst). 2020 Sep;93:102915. doi: 10.1016/j.dnarep.2020.102915. DNA Repair (Amst). 2020. PMID: 33087281 Review.
Cited by
- The Determinant of DNA Repair Pathway Choices in Ionising Radiation-Induced DNA Double-Strand Breaks.
Zhao L, Bao C, Shang Y, He X, Ma C, Lei X, Mi D, Sun Y. Zhao L, et al. Biomed Res Int. 2020 Aug 25;2020:4834965. doi: 10.1155/2020/4834965. eCollection 2020. Biomed Res Int. 2020. PMID: 32908893 Free PMC article. Review. - Targeting ATM-deficient CLL through interference with DNA repair pathways.
Knittel G, Liedgens P, Reinhardt HC. Knittel G, et al. Front Genet. 2015 Jun 10;6:207. doi: 10.3389/fgene.2015.00207. eCollection 2015. Front Genet. 2015. PMID: 26113859 Free PMC article. Review. - Clustered mutations in yeast and in human cancers can arise from damaged long single-strand DNA regions.
Roberts SA, Sterling J, Thompson C, Harris S, Mav D, Shah R, Klimczak LJ, Kryukov GV, Malc E, Mieczkowski PA, Resnick MA, Gordenin DA. Roberts SA, et al. Mol Cell. 2012 May 25;46(4):424-35. doi: 10.1016/j.molcel.2012.03.030. Epub 2012 May 17. Mol Cell. 2012. PMID: 22607975 Free PMC article. - BRCA1-Ku80 protein interaction enhances end-joining fidelity of chromosomal double-strand breaks in the G1 phase of the cell cycle.
Jiang G, Plo I, Wang T, Rahman M, Cho JH, Yang E, Lopez BS, Xia F. Jiang G, et al. J Biol Chem. 2013 Mar 29;288(13):8966-76. doi: 10.1074/jbc.M112.412650. Epub 2013 Jan 23. J Biol Chem. 2013. PMID: 23344954 Free PMC article. - NRF2 preserves genomic integrity by facilitating ATR activation and G2 cell cycle arrest.
Sun X, Wang Y, Ji K, Liu Y, Kong Y, Nie S, Li N, Hao J, Xie Y, Xu C, Du L, Liu Q. Sun X, et al. Nucleic Acids Res. 2020 Sep 18;48(16):9109-9123. doi: 10.1093/nar/gkaa631. Nucleic Acids Res. 2020. PMID: 32729622 Free PMC article.
References
- Ahnesorg P, Smith P, Jackson SP (2006) XLF interacts with the XRCC4–DNA ligase IV complex to promote DNA nonhomologous end-joining. Cell 124: 301–313 - PubMed
- Asakawa Y, Gotoh E (1997) A method for detecting sister chromatid exchanges using prematurely condensed chromosomes and immunogold–silver staining. Mutagenesis 12: 175–177 - PubMed
Publication types
MeSH terms
Substances
LinkOut - more resources
Full Text Sources
Other Literature Sources
Molecular Biology Databases
Research Materials
Miscellaneous


