A disease-mediated trophic cascade in the Serengeti and its implications for ecosystem C - PubMed (original) (raw)
A disease-mediated trophic cascade in the Serengeti and its implications for ecosystem C
Ricardo M Holdo et al. PLoS Biol. 2009 Sep.
Abstract
Tree cover is a fundamental structural characteristic and driver of ecosystem processes in terrestrial ecosystems, and trees are a major global carbon (C) sink. Fire and herbivores have been hypothesized to play dominant roles in regulating trees in African savannas, but the evidence for this is conflicting. Moving up a trophic scale, the factors that regulate fire occurrence and herbivores, such as disease and predation, are poorly understood for any given ecosystem. We used a Bayesian state-space model to show that the wildebeest population eruption that followed disease (rinderpest) eradication in the Serengeti ecosystem of East Africa led to a widespread reduction in the extent of fire and an ongoing recovery of the tree population. This supports the hypothesis that disease has played a key role in the regulation of this ecosystem. We then link our state-space model with theoretical and empirical results quantifying the effects of grazing and fire on soil carbon to predict that this cascade may have led to important shifts in the size of pools of C stored in soil and biomass. Our results suggest that the dynamics of herbivores and fire are tightly coupled at landscape scales, that fire exerts clear top-down effects on tree density, and that disease outbreaks in dominant herbivores can lead to complex trophic cascades in savanna ecosystems. We propose that the long-term status of the Serengeti and other intensely grazed savannas as sources or sinks for C may be fundamentally linked to the control of disease outbreaks and poaching.
Conflict of interest statement
The authors have declared that no competing interests exist.
Figures
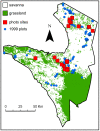
Figure 1. Map of Serengeti National Park with tree density sampling sites.
Shown are locations of photopanorama sites and sampling sites for the 1999 tree density data (only those in savanna sites are shown) . The map also illustrates the main savanna and grassland habitat types. It appears to show fewer than 51 photopanorama sites because several of these were taken close together but with different cardinal orientations.
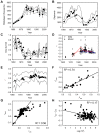
Figure 2. Fits to the data for the best model.
(A) wildebeest, (B) elephants, and (C) proportion of Serengeti National Park burned. Each subfigure illustrates observations (filled circle), posterior means of estimated true values (solid line), and 95% credible intervals for the posterior distributions (dashed lines); standard errors for the observed values are shown for the wildebeest data. (D) Annualized rates of per capita tree density change (r), centred on the midpoints of each time span (e.g., a value of r based on photos taken in 1980 and 1990 is centred on 1985). Correlations among points (corresponding to photo sites) are not shown for legibility, except for two sites: (blue and red solid lines, data; dashed lines, model fit). (E) Model fit for rate of per capita tree density change (mean and 95% credible intervals) plotted jointly over time with observed values of r (the values are means for the midpoint values in [D]). Predicted versus observed values of (F) fire (proportion of area burned) and (G) rates of per capita tree density change, and (H) model residuals from (G) versus the logarithm of initial tree density corresponding to the start of each photo sequence.
Figure 3. Validation of the role of fire with a restricted dataset.
Models that incorporated only the effects of fire, elephants, or rainfall on per capita tree density change were fitted to photopanorama data from the post-1980 period only (1980–2003 data were used for model fitting). The figure shows how well alternative tree dynamics models fit the pre-1980 photopanorama data (the validation period). The original best-fit model (model 3, fitted to the entire dataset) is also plotted for reference. Each data point represents a mean across multiple sites for a particular time period (a midpoint, see Figure 1E).
Figure 4. Rinderpest-mediated regulation of ecosystem dynamics.
(A) Serengeti wildebeest population (filled circle) and rinderpest seroprevalence reported for the periods 1958–1963. (B) Inferred causal relationships driving tree population dynamics in the Serengeti. The dominant effects are shown with thick arrows. Highlighted in red is a four-step pathway of causality linking rinderpest with tree population dynamics. The grass compartment, as an unobserved variable, is shown in dotted outline.
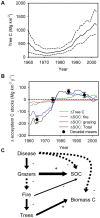
Figure 5. Shifts in ecosystem C balance.
(A) Tree C was modelled with a point estimate of tree biomass C from 1999 . Shown are the posterior mean (solid line) and 95% credible intervals (dashed lines). (B) Simulated changes (as 5-y moving averages) in ecosystem C stocks (total, tree C, and SOC changes driven by fire and grazing to 40 cm depth) and annualized decadal net changes in total ecosystem C balance (means±95% confidence intervals) between 1960–2003; the temporary shift from net sink to source predicted by our simulation in 2000 was driven by drought and resulting overgrazing. (C) Inferred causal pathways linking disease with changes in ecosystem C stocks as a result of a trophic cascade (solid line, direct effects; dashed line, indirect effects).
Comment in
- Disease and the dynamics of food webs.
Getz WM. Getz WM. PLoS Biol. 2009 Sep;7(9):e1000209. doi: 10.1371/journal.pbio.1000209. Epub 2009 Sep 29. PLoS Biol. 2009. PMID: 19787027 Free PMC article. Review.
Similar articles
- Grazers, browsers, and fire influence the extent and spatial pattern of tree cover in the Serengeti.
Holdo RM, Holt RD, Fryxell JM. Holdo RM, et al. Ecol Appl. 2009 Jan;19(1):95-109. doi: 10.1890/07-1954.1. Ecol Appl. 2009. PMID: 19323175 - Fire, grazers, and browsers interact with grass competition to determine tree establishment in an African savanna.
Donaldson JE, Holdo R, Sarakikya J, Anderson TM. Donaldson JE, et al. Ecology. 2022 Aug;103(8):e3715. doi: 10.1002/ecy.3715. Epub 2022 May 25. Ecology. 2022. PMID: 35388482 - Tree cover in sub-Saharan Africa: rainfall and fire constrain forest and savanna as alternative stable states.
Staver AC, Archibald S, Levin S. Staver AC, et al. Ecology. 2011 May;92(5):1063-72. doi: 10.1890/10-1684.1. Ecology. 2011. PMID: 21661567 - Effects of fire on major forest ecosystem processes: an overview.
Chen Z. Chen Z. Ying Yong Sheng Tai Xue Bao. 2006 Sep;17(9):1726-32. Ying Yong Sheng Tai Xue Bao. 2006. PMID: 17147189 Review. - What controls the distribution of tropical forest and savanna?
Murphy BP, Bowman DM. Murphy BP, et al. Ecol Lett. 2012 Jul;15(7):748-58. doi: 10.1111/j.1461-0248.2012.01771.x. Epub 2012 Mar 27. Ecol Lett. 2012. PMID: 22452780 Review.
Cited by
- News Feature: Can predators have a big impact on carbon emissions calculations?
Willoughby L. Willoughby L. Proc Natl Acad Sci U S A. 2018 Mar 6;115(10):2260-2263. doi: 10.1073/pnas.1802169115. Proc Natl Acad Sci U S A. 2018. PMID: 29511124 Free PMC article. No abstract available. - Contribution of host species and pathogen clade to snake fungal disease hotspots in Europe.
Blanvillain G, Lorch JM, Joudrier N, Bury S, Cuenot T, Franzen M, Martínez-Freiría F, Guiller G, Halpern B, Kolanek A, Kurek K, Lourdais O, Michon A, Musilová R, Schweiger S, Szulc B, Ursenbacher S, Zinenko O, Hoyt JR. Blanvillain G, et al. Commun Biol. 2024 Apr 10;7(1):440. doi: 10.1038/s42003-024-06092-x. Commun Biol. 2024. PMID: 38600171 Free PMC article. - Anthroponumbers.org: A quantitative database of human impacts on Planet Earth.
Chure G, Banks RA, Flamholz AI, Sarai NS, Kamb M, Lopez-Gomez I, Bar-On Y, Milo R, Phillips R. Chure G, et al. Patterns (N Y). 2022 Aug 3;3(9):100552. doi: 10.1016/j.patter.2022.100552. eCollection 2022 Sep 9. Patterns (N Y). 2022. PMID: 36124305 Free PMC article. - Implications of the spatial dynamics of fire spread for the bistability of savanna and forest.
Schertzer E, Staver AC, Levin SA. Schertzer E, et al. J Math Biol. 2015 Jan;70(1-2):329-41. doi: 10.1007/s00285-014-0757-z. Epub 2014 Feb 26. J Math Biol. 2015. PMID: 24570348 - Environmental reservoir dynamics predict global infection patterns and population impacts for the fungal disease white-nose syndrome.
Hoyt JR, Langwig KE, Sun K, Parise KL, Li A, Wang Y, Huang X, Worledge L, Miller H, White JP, Kaarakka HM, Redell JA, Görföl T, Boldogh SA, Fukui D, Sakuyama M, Yachimori S, Sato A, Dalannast M, Jargalsaikhan A, Batbayar N, Yovel Y, Amichai E, Natradze I, Frick WF, Foster JT, Feng J, Kilpatrick AM. Hoyt JR, et al. Proc Natl Acad Sci U S A. 2020 Mar 31;117(13):7255-7262. doi: 10.1073/pnas.1914794117. Epub 2020 Mar 16. Proc Natl Acad Sci U S A. 2020. PMID: 32179668 Free PMC article.
References
- Scanlon T. M, Caylor K. K, Manfreda S, Levin S. A, Rodriguez-Iturbe I. Dynamic response of grass cover to rainfall variability: implications for the function and persistence of savanna ecosystems. Adv Water Resour. 2005;28:291–302.
- Jackson R. B, Banner J. L, Jobbagy E. G, Pockman W. T, Wall D. H. Ecosystem carbon loss with woody plant invasion of grasslands. Nature. 2002;418:623–626. - PubMed
- Sankaran M, Ratnam J, Hanan N. P. Tree-grass coexistence in savannas revisited - insights from an examination of assumptions and mechanisms invoked in existing models. Ecol Lett. 2004;7:480–490.
- Bond W. J. What limits trees in C4 grasslands and savannas? Annu Rev Ecol Evol S. 2008;39:641–659.
- Sankaran M, Hanan N. P, Scholes R. J, Ratnam J, Augustine D. J, et al. Determinants of woody cover in African savannas. Nature. 2005;438:846–849. - PubMed
Publication types
MeSH terms
LinkOut - more resources
Full Text Sources
Other Literature Sources


