Novel subtype-specific genes identify distinct subpopulations of callosal projection neurons - PubMed (original) (raw)
Comparative Study
Novel subtype-specific genes identify distinct subpopulations of callosal projection neurons
Bradley J Molyneaux et al. J Neurosci. 2009.
Abstract
Little is known about the molecular development and heterogeneity of callosal projection neurons (CPN), cortical commissural neurons that connect homotopic regions of the two cerebral hemispheres via the corpus callosum and that are critical for bilateral integration of cortical information. Here we report on the identification of a series of genes that individually and in combination define CPN and novel CPN subpopulations during embryonic and postnatal development. We used in situ hybridization analysis, immunocytochemistry, and retrograde labeling to define the layer-specific and neuron-type-specific distribution of these newly identified CPN genes across different stages of maturation. We demonstrate that a subset of these genes (e.g., Hspb3 and Lpl) appear specific to all CPN (in layers II/III and V-VI), whereas others (e.g., Nectin-3, Plexin-D1, and Dkk3) discriminate between CPN of the deep layers and those of the upper layers. Furthermore, the data show that several genes finely subdivide CPN within individual layers and appear to label CPN subpopulations that have not been described previously using anatomical or morphological criteria. The genes identified here likely reflect the existence of distinct programs of gene expression governing the development, maturation, and function of the newly identified subpopulations of CPN. Together, these data define the first set of genes that identify and molecularly subcategorize distinct populations of callosal projection neurons, often located in distinct subdivisions of the canonical cortical laminae.
Figures
Figure 1.
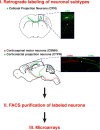
Schematic representation of the experimental approach used to identify CPN-specific genes. CPN, CSMN, and CTPN were retrogradely labeled at distinct stages of development from the contralateral hemisphere, the spinal cord, and the superior colliculus, respectively. Labeled neurons were dissociated, FACS purified, and submitted to comparative microarray analysis.
Figure 2.
CPN genes that label most callosal projection neurons across layers II/III and V. A–C, Temporal profiles of gene expression from microarray analysis in CPN (gray) versus CSMN (black) during embryonic (E18) and early postnatal (P3, P6, and P14) stages of development. Error bars indicate SEM. A′–C′, In situ hybridization in coronal sections of cortex showing that the expression of selected genes closely resembles the typical distribution of the retrogradely labeled, broad CPN population (D). A″–C″, Magnification of selected areas from A′–C′. Ages are as indicated in A′–C′. E–N, Lpl and Hspb3 are expressed in CPN across layers II/III and V and not in CSMN. E, Fluorescent in situ hybridization for Lpl (green) in a coronal section of P8 cortex demonstrates that it is expressed in CPN identified by retrograde labeling via injection of CTB555 (red) in the contralateral cortex at P6. F, G, Magnification of selected areas in layers II/III and V from E; arrows indicate _Lpl_-expressing CPN. H, Fluorescent in situ hybridization for Hspb3 (green) in a coronal section of P8 cortex demonstrates that it is expressed in retrogradely labeled CPN (red). I, J, Magnification of selected areas in layers II/III and V from H; arrows indicate _Hspb3_-expressing CPN. K, Fluorescent in situ hybridization for Lpl (green) in a coronal section of P8 cortex demonstrates that it is not expressed in CSMN identified by retrograde labeling via injection of CTB555 (red) in the spinal cord at P4 (high magnification shown in L). M, Fluorescent in situ hybridization for Hspb3 (green) in a coronal section of P8 cortex demonstrates that it is also not expressed in retrogradely labeled CSMN (red) (high magnification shown in N). Scale bars: A″–C″, 100 μm; E, H, K, M, 200 μm; F, G, I, J, L, N, 50 μm.
Figure 3.
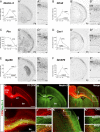
CPN genes that selectively label callosal neurons of the superficial layers II/III and IV. A–F, Temporal profiles of gene expression from microarray analysis in CPN (gray) versus CSMN (black) during embryonic (E18) and early postnatal (P3, P6, and P14) stages of development. Error bars indicate SEM. A′–F′, In situ hybridization in coronal sections of cortex showing preferential CPN gene expression in the superficial layers. A″–F″, Magnification of selected areas from A′–F′. Ages are as indicated in A′–F′. Scale bars: A″–F″, 100 μm.
Figure 4.
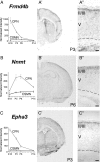
CPN genes that preferentially label the most superficial portion of layer II/III and layer I. A–C, Temporal profiles of gene expression from microarray analysis in CPN (gray) versus CSMN (black) during embryonic (E18) and early postnatal (P3, P6, and P14) stages of development. Error bars indicate SEM. A′–C′, In situ hybridization in coronal sections of cortex showing preferential CPN gene expression in the most superficial portions of layer II/III. A″–C″, Magnification of selected areas from A′–C′. Ages are as indicated in A′–C′. Scale bars: A″–C″, 100 μm.
Figure 5.
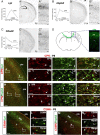
CPN genes that preferentially label the deepest portion of layer II/III and layer IV. A–F, Temporal profiles of gene expression from microarray analysis in CPN (gray) versus CSMN (black) during embryonic (E18) and early postnatal (P3, P6, and P14) stages of development. Error bars indicate SEM. A′–F′, In situ hybridization in coronal sections of cortex showing preferential CPN gene expression in the deepest portions of layer II/III and IV. A″–F″, Magnification of selected areas from A′–F′. G–K, Nectin-3 is expressed in CPN in layer II/III and in CPN axons in the corpus callosum at P1. G, CPN retrogradely labeled with CTB555 (red) via injections into contralateral cortex at P0. H, I, Nectin-3 immunocytochemistry (green) detects Nectin-3 expression in CPN in layer II/III, as well as in CPN axons in the corpus callosum. J, Magnification of selected area in I. J′, Magnification of selected area in J, showing expression of Nectin-3 in a subset of CPN axons in the corpus callosum. K, Magnification of selected area in I. K′, Magnification of selected area in K, showing expression of Nectin-3 in CPN in layer II/III. CTB inj, Site of CTB555 injection; CC, corpus callosum; LV, lateral ventricle; Str, striatum. Ages are as indicated in A′–E′ and G. Scale bars: A″–E″, 100 μm; G–I, 500 μm; J, K, 100 μm; J′, K′, 50 μm.
Figure 6.
Genes that preferentially label CPN of the deep layers V and VI. A–D, Temporal profiles of gene expression from microarray analysis in CPN (gray) versus CSMN (black) during embryonic (E18) and early postnatal (P3, P6, and P14) stages of development. Error bars indicate SEM. A′–D′, In situ hybridization in coronal sections of cortex showing preferential CPN gene expression in the deep layers V and VI. A″–D″, Magnification of the areas boxed in A′–D′. Ages are as indicated in A′–D′. Scale bars: A″–D″, 100 μm.
Figure 7.
Specific expression of Plexin-D1 and Dkk3 in retrogradely labeled CPN of the deep layers V and VI. A–H, Plexin-D1 is expressed by CPN of the deep layer V and not by CSMN. A, Fluorescent in situ hybridization for Plexin-D1 (green) in a coronal section of P8 cortex demonstrates that it is expressed within CPN (red) identified via injection of CTB555 into contralateral cortex at P6. B–D, Magnification of selected area from A reveals that essentially all _Plexin-D1_-expressing cells are CPN (arrows). E–H, Fluorescent in situ hybridization for Plexin-D1 (green) in a coronal section of P8 cortex demonstrates that it is not expressed in CSMN (red) identified retrogradely labeled via spinal cord injection of CTB555. F–H, Magnification of selected area from E, with the arrow indicating a CSMN that is adjacent to a _PlexinD1_-expressing cell (arrowhead). I–P, Dkk3 is expressed by CPN of the deep layers V and VI and not by CSMN. I, Fluorescent in situ hybridization for Dkk3 (green) in a coronal section of P8 cortex demonstrates that it is expressed in CPN (red) identified via injection of CTB555 into contralateral cortex at P6. J–L, Magnification of selected area from I, with arrows indicating _Dkk3_-positive CPN; notably, a subset of _Dkk3_-expressing cells are not retrogradely labeled. M, Fluorescent in situ hybridization for Dkk3 (green) in a coronal section of P8 cortex demonstrates that Dkk3 is not expressed in CSMN (red) retrogradely labeled via spinal cord injection of CTB555. N–P, Magnification of selected area from M, with arrows indicating CSMN that do not express Dkk3. Scale bars: A, E, I, M, 200 μm; B–D, F–H, J–L, N–P, 50 μm.
Figure 8.
Combinations of genes reveal subdivisions within canonical cortical laminae. In situ hybridization at P6 for representative genes in sequential coronal sections of cortex from the same mouse, showing molecularly distinct populations of CPN identify subcompartments within the canonical cortical layers. Solid lines identify layers, and dotted lines identify subdivisions of the layers demarcated by in situ hybridization for a subset of the genes identified. Scale bars, 50 μm.
Similar articles
- Cited2 Regulates Neocortical Layer II/III Generation and Somatosensory Callosal Projection Neuron Development and Connectivity.
Fame RM, MacDonald JL, Dunwoodie SL, Takahashi E, Macklis JD. Fame RM, et al. J Neurosci. 2016 Jun 15;36(24):6403-19. doi: 10.1523/JNEUROSCI.4067-15.2016. J Neurosci. 2016. PMID: 27307230 Free PMC article. - Subtype-Specific Genes that Characterize Subpopulations of Callosal Projection Neurons in Mouse Identify Molecularly Homologous Populations in Macaque Cortex.
Fame RM, Dehay C, Kennedy H, Macklis JD. Fame RM, et al. Cereb Cortex. 2017 Mar 1;27(3):1817-1830. doi: 10.1093/cercor/bhw023. Cereb Cortex. 2017. PMID: 26874185 Free PMC article. - Caveolin1 Identifies a Specific Subpopulation of Cerebral Cortex Callosal Projection Neurons (CPN) Including Dual Projecting Cortical Callosal/Frontal Projection Neurons (CPN/FPN).
MacDonald JL, Fame RM, Gillis-Buck EM, Macklis JD. MacDonald JL, et al. eNeuro. 2018 Jan 18;5(1):ENEURO.0234-17.2017. doi: 10.1523/ENEURO.0234-17.2017. eCollection 2018 Jan-Feb. eNeuro. 2018. PMID: 29379878 Free PMC article. - Development, specification, and diversity of callosal projection neurons.
Fame RM, MacDonald JL, Macklis JD. Fame RM, et al. Trends Neurosci. 2011 Jan;34(1):41-50. doi: 10.1016/j.tins.2010.10.002. Epub 2010 Dec 2. Trends Neurosci. 2011. PMID: 21129791 Free PMC article. Review. - Activity-dependent development of interhemispheric connections in the visual cortex.
Tagawa Y, Mizuno H, Hirano T. Tagawa Y, et al. Rev Neurosci. 2008;19(1):19-28. doi: 10.1515/revneuro.2008.19.1.19. Rev Neurosci. 2008. PMID: 18561818 Review.
Cited by
- Cerebral cortex assembly: generating and reprogramming projection neuron diversity.
Lodato S, Shetty AS, Arlotta P. Lodato S, et al. Trends Neurosci. 2015 Feb;38(2):117-25. doi: 10.1016/j.tins.2014.11.003. Epub 2014 Dec 17. Trends Neurosci. 2015. PMID: 25529141 Free PMC article. Review. - Lmo4 establishes rostral motor cortex projection neuron subtype diversity.
Cederquist GY, Azim E, Shnider SJ, Padmanabhan H, Macklis JD. Cederquist GY, et al. J Neurosci. 2013 Apr 10;33(15):6321-32. doi: 10.1523/JNEUROSCI.5140-12.2013. J Neurosci. 2013. PMID: 23575831 Free PMC article. - Revealing the Impact of Mitochondrial Fitness During Early Neural Development Using Human Brain Organoids.
Romero-Morales AI, Gama V. Romero-Morales AI, et al. Front Mol Neurosci. 2022 Apr 29;15:840265. doi: 10.3389/fnmol.2022.840265. eCollection 2022. Front Mol Neurosci. 2022. PMID: 35571368 Free PMC article. Review. - Neuronal subtype-specific growth cone and soma purification from mammalian CNS via fractionation and fluorescent sorting for subcellular analyses and spatial mapping of local transcriptomes and proteomes.
Engmann AK, Hatch JJ, Nanda P, Veeraraghavan P, Ozkan A, Poulopoulos A, Murphy AJ, Macklis JD. Engmann AK, et al. Nat Protoc. 2022 Feb;17(2):222-251. doi: 10.1038/s41596-021-00638-7. Epub 2022 Jan 12. Nat Protoc. 2022. PMID: 35022617 Free PMC article. Review. - Cortical connectivity and sensory coding.
Harris KD, Mrsic-Flogel TD. Harris KD, et al. Nature. 2013 Nov 7;503(7474):51-8. doi: 10.1038/nature12654. Nature. 2013. PMID: 24201278 Review.
References
- Aboitiz F, Morales D, Montiel J. The evolutionary origin of the mammalian isocortex: towards an integrated developmental and functional approach. Behav Brain Sci. 2003;26:535–552. discussion 552–585. - PubMed
- Alcamo EA, Chirivella L, Dautzenberg M, Dobreva G, Fariñas I, Grosschedl R, McConnell SK. Satb2 regulates callosal projection neuron identity in the developing cerebral cortex. Neuron. 2008;57:364–377. - PubMed
- Angevine JB, Jr, Sidman RL. Autoradiographic study of cell migration during histogenesis of cerebral cortex in mouse. Nature. 1961;192:766–768. - PubMed
- Arlotta P, Molyneaux BJ, Chen J, Inoue J, Kominami R, Macklis JD. Neuronal subtype-specific genes that control corticospinal motor neuron development in vivo. Neuron. 2005;45:207–221. - PubMed
- Berger UV, Hediger MA. Differential distribution of the glutamate transporters GLT-1 and GLAST in tanycytes of the third ventricle. J Comp Neurol. 2001;433:101–114. - PubMed
Publication types
MeSH terms
Substances
Grants and funding
- R01 NS049553/NS/NINDS NIH HHS/United States
- R37 NS041590/NS/NINDS NIH HHS/United States
- NS49553./NS/NINDS NIH HHS/United States
- R01 NS045523/NS/NINDS NIH HHS/United States
- NS41590/NS/NINDS NIH HHS/United States
- NS45523/NS/NINDS NIH HHS/United States
- R01 NS041590/NS/NINDS NIH HHS/United States
LinkOut - more resources
Full Text Sources
Molecular Biology Databases
Research Materials


