The structure of an integrin/talin complex reveals the basis of inside-out signal transduction - PubMed (original) (raw)
The structure of an integrin/talin complex reveals the basis of inside-out signal transduction
Nicholas J Anthis et al. EMBO J. 2009.
Abstract
Fundamental to cell adhesion and migration, integrins are large heterodimeric membrane proteins that uniquely mediate inside-out signal transduction, whereby adhesion to the extracellular matrix is activated from within the cell by direct binding of talin to the cytoplasmic tail of the beta integrin subunit. Here, we report the first structure of talin bound to an authentic full-length beta integrin tail. Using biophysical and whole cell measurements, we show that a specific ionic interaction between the talin F3 domain and the membrane-proximal helix of the beta tail disrupts an integrin alpha/beta salt bridge that helps maintain the integrin inactive state. Second, we identify a positively charged surface on the talin F2 domain that precisely orients talin to disrupt the heterodimeric integrin transmembrane (TM) complex. These results show key structural features that explain the ability of talin to mediate inside-out TM signalling.
Conflict of interest statement
The authors declare that they have no conflict of interest.
Figures
Figure 1
Integrin and talin sequence comparisons. (A) Sequence of the cytoplasmic tail of the β1A, β1D, and β3 integrins. Residues in β1D and β3 that differ from β1A are highlighted, and a key membrane–proximal aspartate residue is indicated with β1 numbering. Secondary structure (α helices in blue, 310 helices in green) is based on the β1D/talin2 complex structure. Residues embedded in the membrane (Lau et al, 2008b) are shaded in grey. Residues are coloured by chemical properties: acidic residues are shown in red, basic in blue, aliphatic in green, aromatic in cyan, polar in lavender, and others are given unique colouring. (B) Sequence of the F2–F3 domains of talin1 and talin2. Residues in talin2 that differ from talin1 are highlighted, and secondary structure was determined as in (A). The F2 domain is underlined in cyan and the F3 in yellow. (C) A schematic of the domain structure of talin. Talin homodimerization (not shown) occurs at the C-terminus.
Figure 2
The talin2/β1D structure. (A) One heterodimer from the crystal structure of talin2 F2–F3 bound to the β1D integrin tail. Labelling is for talin2/β1D with talin1/β3 numbering in parentheses. Highlighted residues interact with the membrane or form a key integrin/talin salt bridge. All structure images were generated with MOLMOL (Koradi et al, 1996). (B) The talin2/β1D structure was merged with the β3 transmembrane segment (PDB ) (Lau et al, 2008b) and aligned to the calculated membrane tilt angle of 25°. The electrostatic potential is mapped on talin, illustrating the juxtaposition of several positively charged residues next to the membrane surface.
Figure 3
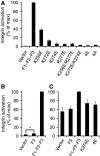
A key role for a talin/membrane interaction in integrin activation. (A) GFP-talin1 F1–F2–F3 wild type (F1–F2–F3) or F1–F2–F3 with various mutations in the F2 domain were transfected into αIIbβ3-expressing CHO cells. Activated integrins were detected with PAC1 antibody and analysed by FACS 24 h after transfection. Integrin activity was normalized against GFP-F1–F2–F3 wt-transfected cells. Error bars represent standard errors of three independent experiments. 4E corresponds to all four membrane orientation patch (MOP) residues mutated to glutamate, and 4A corresponds to all four mutated to alanine. (B) As in (A), but with GFP-talin1 F3 wt or F1–F2–F3 wt. Error bars (barely visible because of small size) represent standard errors of two independent experiments. F3 caused a statistically significant increase in integrin activation (*) of _P_=0.0388 by one tail test. (C) As in (A) and (B), but GFP-talin1 F3 wt, F1–F2-F3 wt, or F1–F2–F3 mutants were transfected into CHO cells expressing a chimaeric integrin containing the intracellular domains of α5β1A, as described in the text. Error bars represent standard errors of four independent experiments.
Figure 4
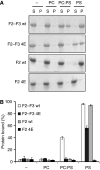
The talin F2 domain membrane orientation patch (MOP) interacts with negatively charged membrane phospholipids. Talin1 F2–F3 and F2 (0.15 mg/ml), either wt or 4E, were mixed with vesicles (0.5 mg/ml) consisting of phosphatidylcholine (PC), phosphatidylserine (PS), or a 4:1 ratio of PC:PS and then centrifuged. (A) Coomassie-stained gel of one representative experiment. Unbound protein was located in the supernatant (S) and bound protein in the pellet (P). (B) Graphical representation of the percentage of protein bound to lipid vesicles (average of three independent experiments±standard error).
Figure 5
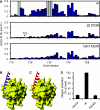
A key salt bridge between talin and the β integrin tail. (A) Weighted shift maps of perturbations observed in 1H–15N HSQC spectra of the β3 tail on the addition of talin1 F3. Experiments were performed on β3 wt with talin1 wt, β3 D723R with talin1 wt, and β3 wt with talin1 K324D. Grey bars correspond to residues that could not be tracked because of exchange broadening. (B) Chemical shift perturbations in β3 on binding to talin1 F3 wt domain mapped onto the β1D/talin2 structure (largest shifts in blue, smallest in red). (C) As in (B) but with β3 D723R. (D) As in Figure 3A, but exploring the effect of talin1 F0–F1–F2–F3 wt or K324D on activation of αIIbβ3 expressed in CHO cells.
Figure 6
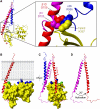
Disruption of the α/β integrin dimer by talin. (A) Overlay of the talin2/β1D structure (plus β3 TM) with the αIIbβ3 TM structure (PDB ) (Lau et al, 2009). Talin is shown in yellow, αIIb in blue, β3/β1D bound to talin in red, and β3/β1D bound to αIIb in magenta. Inset shows inner membrane clasp competition. (B) The talin2/β1D structure (plus β3 TM) has been reoriented by 20° so that maximal contact is achieved between the membrane and the talin F2 membrane orientation patch (MOP). Membrane-targeting residues in F2 are highlighted in blue, and talin2 K325 (talin1 K322) in the F3 domain is highlighted in green. (C) The structure in (B) shown in an orthogonal ‘back' view. The inactive αIIbβ3 transmembrane domain complex has been added to illustrate the change in β tilt angle on activation. The β3 TM structure has been extended into the cytoplasm by combining it with the β1D tail structure. Talin2 K327 (talin1 K324) is highlighted in cyan. (D) The same view as (C), but with only the two β integrin tails shown to highlight the 20° change in tilt angle.
Figure 7
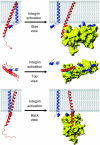
Model of integrin activation by talin, shown in three orientations. When talin binds to the β integrin tail it forms an extensive interface with the tail, including a membrane–proximal salt bridge, disrupting the salt bridge between the α and β subunits. To maximize contacts between the membrane and the positively charged membrane orientation patch (MOP) on the talin F2 domain, the β integrin must be reoriented with respect to the membrane by approximately 20°. Through these actions talin causes α/β separation, inducing the active state in the extracellular region.
Similar articles
- Structural basis of integrin activation by talin.
Wegener KL, Partridge AW, Han J, Pickford AR, Liddington RC, Ginsberg MH, Campbell ID. Wegener KL, et al. Cell. 2007 Jan 12;128(1):171-82. doi: 10.1016/j.cell.2006.10.048. Cell. 2007. PMID: 17218263 - The phosphotyrosine binding-like domain of talin activates integrins.
Calderwood DA, Yan B, de Pereda JM, Alvarez BG, Fujioka Y, Liddington RC, Ginsberg MH. Calderwood DA, et al. J Biol Chem. 2002 Jun 14;277(24):21749-58. doi: 10.1074/jbc.M111996200. Epub 2002 Apr 3. J Biol Chem. 2002. PMID: 11932255 - The NPIY motif in the integrin beta1 tail dictates the requirement for talin-1 in outside-in signaling.
Nieves B, Jones CW, Ward R, Ohta Y, Reverte CG, LaFlamme SE. Nieves B, et al. J Cell Sci. 2010 Apr 15;123(Pt 8):1216-26. doi: 10.1242/jcs.056549. Epub 2010 Mar 23. J Cell Sci. 2010. PMID: 20332112 Free PMC article. - The tail of integrins, talin, and kindlins.
Moser M, Legate KR, Zent R, Fässler R. Moser M, et al. Science. 2009 May 15;324(5929):895-9. doi: 10.1126/science.1163865. Science. 2009. PMID: 19443776 Review. - The tale of two talins - two isoforms to fine-tune integrin signalling.
Gough RE, Goult BT. Gough RE, et al. FEBS Lett. 2018 Jun;592(12):2108-2125. doi: 10.1002/1873-3468.13081. Epub 2018 May 18. FEBS Lett. 2018. PMID: 29723415 Free PMC article. Review.
Cited by
- Initial activation of STIM1, the regulator of store-operated calcium entry.
Zhou Y, Srinivasan P, Razavi S, Seymour S, Meraner P, Gudlur A, Stathopulos PB, Ikura M, Rao A, Hogan PG. Zhou Y, et al. Nat Struct Mol Biol. 2013 Aug;20(8):973-81. doi: 10.1038/nsmb.2625. Epub 2013 Jul 14. Nat Struct Mol Biol. 2013. PMID: 23851458 Free PMC article. - The dual structural roles of the membrane distal region of the α-integrin cytoplasmic tail during integrin inside-out activation.
Liu J, Wang Z, Thinn AM, Ma YQ, Zhu J. Liu J, et al. J Cell Sci. 2015 May 1;128(9):1718-31. doi: 10.1242/jcs.160663. Epub 2015 Mar 6. J Cell Sci. 2015. PMID: 25749862 Free PMC article. - CW-EPR studies revealed different motional properties and oligomeric states of the integrin β1a transmembrane domain in detergent micelles or liposomes.
Yu L, Wang W, Ling S, Liu S, Xiao L, Xin Y, Lai C, Xiong Y, Zhang L, Tian C. Yu L, et al. Sci Rep. 2015 Jan 19;5:7848. doi: 10.1038/srep07848. Sci Rep. 2015. PMID: 25597475 Free PMC article. - The interaction of talin with the cell membrane is essential for integrin activation and focal adhesion formation.
Chinthalapudi K, Rangarajan ES, Izard T. Chinthalapudi K, et al. Proc Natl Acad Sci U S A. 2018 Oct 9;115(41):10339-10344. doi: 10.1073/pnas.1806275115. Epub 2018 Sep 25. Proc Natl Acad Sci U S A. 2018. PMID: 30254158 Free PMC article. - The ILK/PINCH/parvin complex: the kinase is dead, long live the pseudokinase!
Wickström SA, Lange A, Montanez E, Fässler R. Wickström SA, et al. EMBO J. 2010 Jan 20;29(2):281-91. doi: 10.1038/emboj.2009.376. Epub 2009 Dec 24. EMBO J. 2010. PMID: 20033063 Free PMC article. Review.
References
- Abramoff MD, Magelhaes PJ, Ram SJ (1994) Image processing with ImageJ. Biophoton Int 11: 36–42
- Adams PD, Grosse-Kunstleve RW, Hung LW, Ioerger TR, McCoy AJ, Moriarty NW, Read RJ, Sacchettini JC, Sauter NK, Terwilliger TC (2002) PHENIX: building new software for automated crystallographic structure determination. Acta Crystallogr D Biol Crystallogr 58(Part 11): 1948–1954 - PubMed
- Ayed A, Mulder FA, Yi GS, Lu Y, Kay LE, Arrowsmith CH (2001) Latent and active p53 are identical in conformation. Nat Struct Biol 8: 756–760 - PubMed
Publication types
MeSH terms
Substances
Grants and funding
- WT_/Wellcome Trust/United Kingdom
- R01 AR027214/AR/NIAMS NIH HHS/United States
- AR27214/AR/NIAMS NIH HHS/United States
- R37 AR027214/AR/NIAMS NIH HHS/United States
- P01 HL078784/HL/NHLBI NIH HHS/United States
- HL078784/HL/NHLBI NIH HHS/United States
- CRUK_/Cancer Research UK/United Kingdom
LinkOut - more resources
Full Text Sources
Miscellaneous


