Single-cell response to stiffness exhibits muscle-like behavior - PubMed (original) (raw)
Single-cell response to stiffness exhibits muscle-like behavior
Démosthène Mitrossilis et al. Proc Natl Acad Sci U S A. 2009.
Abstract
Living cells sense the rigidity of their environment and adapt their activity to it. In particular, cells cultured on elastic substrates align their shape and their traction forces along the direction of highest stiffness and preferably migrate towards stiffer regions. Although numerous studies investigated the role of adhesion complexes in rigidity sensing, less is known about the specific contribution of acto-myosin based contractility. Here we used a custom-made single-cell technique to measure the traction force as well as the speed of shortening of isolated myoblasts deflecting microplates of variable stiffness. The rate of force generation increased with increasing stiffness and followed a Hill force-velocity relationship. Hence, cell response to stiffness was similar to muscle adaptation to load, reflecting the force-dependent kinetics of myosin binding to actin. These results reveal an unexpected mechanism of rigidity sensing, whereby the contractile acto-myosin units themselves can act as sensors. This mechanism may translate anisotropy in substrate rigidity into anisotropy in cytoskeletal tension, and could thus coordinate local activity of adhesion complexes and guide cell migration along rigidity gradients.
Conflict of interest statement
The authors declare no conflict of interest.
Figures
Fig. 1.
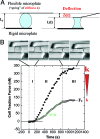
Traction force measurements. (A) Principle of force measurements and specific geometrical relations. A single cell spreading between two parallel glass microplates generates traction forces. One plate is rigid and maintained at a fixed position, the other is flexible, calibrated in stiffness, and used as a nano-Newton force sensor. Thus, force, stiffness, and deflection are related: F = _k_δ. Moreover, the flexible plate deflection δ is equal to the cell shortening (L 0 − L). Hence, the rate of force increase dF/dt is proportional to the speed V of cell shortening. (B) A single C2.7 cell spreading between the two parallel microplates. The upper plate is flexible, the other rigid. Cell-shape evolution during spreading and traction force generation were related (See also supplementary movies M1 and M2 in the
SI Appendix
). The plateau force F p as well as the rate of force increase dFdt were increasing functions of the stiffness k of the flexible plate. The two sets of data are representative of force evolution at low (open circles, k = 21 nN/μm) and high stiffness values (filled circles, infinite k).
Fig. 2.
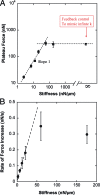
Effect of the stiffness on force generation. (A) Plateau force F p (filled squares) vs. flexible plate stiffness k in log–log coordinates. The partially filled square corresponds to relaxation experiments allowing us to mimic the effect of infinite stiffness (see Results for details). F p was proportional to k for stiffness values lower than 60 nN/μm, and saturated at ≈300 nN, which appeared to be the maximum traction force the C2.7 myoblasts could generate in a parallel plates arrangement. (B) Rate of force increase dFdt (filled circles) measured at a plate deflection δ0 = 1 μ_m_. The force generated by the cell increased faster when pulling on a stiffer plate. In particular, dFdt was proportional to k for stiffness values lower than 60 nN/μm, in excellent agreement with F p behavior.
Fig. 3.
Contractile activity of single C2.7 cells in response to the myosin inhibitor blebbistatin. Contractile activity was expressed as the ratio of the maximal traction force after addition of blebbistatin F([Blebb]) and the maximal force without blebbistatin (F max = 297 nN). F([Blebb])/F max decreased with blebbistatin concentration. The inhibitory constant (Ki ∼ 2.8 μM) was in excellent agreement with the Ki values found for mouse cardiac muscles as well as for the ATPase activity of nonmuscle myosin II (24, 25).
Fig. 4.
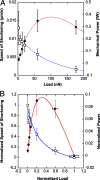
Hill equation of muscle contraction fits single cell data. (A) Cell speed of shortening V (open squares) and mechanical power P = FV (filled circles) as functions of the load F. V and P data were fitted following the Hill equation of muscle (acto-myosin) contraction: V=cF+a−b, where a, b, and c are characteristic constants. V and P data were fitted using the same set of constants {a,b,c}. (B) Normalized speed of cell shortening v=VVmax (open squares) and normalized power p=PFmaxVmax as a function of the normalized load f=FFmax. The solid curves correspond to the reduced Hill equation accounting for muscle adaptation to load ((f + r)(v + r) = (1 + r)r, r = 0.25). Note that the normalized data conform to the Hill curve without any fitting. p is maximum at ≈0.31_F_ max as observed in muscles, which corresponds to a maximum efficiency of the C2.7 myoblasts when deforming substrates of ≈ 8 kPa Young modulus, and can be compared to optimum striation of myotubes around 12 kPa (34) (see Discussion and Appendix 2 for details).
Similar articles
- Acto-myosin based response to stiffness and rigidity sensing.
Fouchard J, Mitrossilis D, Asnacios A. Fouchard J, et al. Cell Adh Migr. 2011 Jan-Feb;5(1):16-9. doi: 10.4161/cam.5.1.13281. Epub 2011 Jan 1. Cell Adh Migr. 2011. PMID: 20818154 Free PMC article. - Mechanics of cell spreading within 3D-micropatterned environments.
Ghibaudo M, Di Meglio JM, Hersen P, Ladoux B. Ghibaudo M, et al. Lab Chip. 2011 Mar 7;11(5):805-12. doi: 10.1039/c0lc00221f. Epub 2010 Dec 6. Lab Chip. 2011. PMID: 21132213 - Cell response to substrate rigidity is regulated by active and passive cytoskeletal stress.
Doss BL, Pan M, Gupta M, Grenci G, Mège RM, Lim CT, Sheetz MP, Voituriez R, Ladoux B. Doss BL, et al. Proc Natl Acad Sci U S A. 2020 Jun 9;117(23):12817-12825. doi: 10.1073/pnas.1917555117. Epub 2020 May 22. Proc Natl Acad Sci U S A. 2020. PMID: 32444491 Free PMC article. - Cell and tissue mechanics in cell migration.
Lange JR, Fabry B. Lange JR, et al. Exp Cell Res. 2013 Oct 1;319(16):2418-23. doi: 10.1016/j.yexcr.2013.04.023. Epub 2013 May 9. Exp Cell Res. 2013. PMID: 23664834 Free PMC article. Review. - Sensing substrate rigidity by mechanosensitive ion channels with stress fibers and focal adhesions.
Kobayashi T, Sokabe M. Kobayashi T, et al. Curr Opin Cell Biol. 2010 Oct;22(5):669-76. doi: 10.1016/j.ceb.2010.08.023. Epub 2010 Sep 16. Curr Opin Cell Biol. 2010. PMID: 20850289 Review.
Cited by
- A time-dependent phenomenological model for cell mechano-sensing.
Borau C, Kamm RD, García-Aznar JM. Borau C, et al. Biomech Model Mechanobiol. 2014 Apr;13(2):451-62. doi: 10.1007/s10237-013-0508-x. Epub 2013 Jun 20. Biomech Model Mechanobiol. 2014. PMID: 23783520 Free PMC article. - Increased stiffness of the tumor microenvironment in colon cancer stimulates cancer associated fibroblast-mediated prometastatic activin A signaling.
Bauer J, Emon MAB, Staudacher JJ, Thomas AL, Zessner-Spitzenberg J, Mancinelli G, Krett N, Saif MT, Jung B. Bauer J, et al. Sci Rep. 2020 Jan 9;10(1):50. doi: 10.1038/s41598-019-55687-6. Sci Rep. 2020. PMID: 31919369 Free PMC article. - Quantifying dissipation in actomyosin networks.
Floyd C, Papoian GA, Jarzynski C. Floyd C, et al. Interface Focus. 2019 Jun 6;9(3):20180078. doi: 10.1098/rsfs.2018.0078. Epub 2019 Apr 19. Interface Focus. 2019. PMID: 31065344 Free PMC article. - Cells as liquid motors: mechanosensitivity emerges from collective dynamics of actomyosin cortex.
Étienne J, Fouchard J, Mitrossilis D, Bufi N, Durand-Smet P, Asnacios A. Étienne J, et al. Proc Natl Acad Sci U S A. 2015 Mar 3;112(9):2740-5. doi: 10.1073/pnas.1417113112. Epub 2015 Feb 17. Proc Natl Acad Sci U S A. 2015. PMID: 25730854 Free PMC article. - Capillary muscle.
Cohen C, Mouterde T, Quéré D, Clanet C. Cohen C, et al. Proc Natl Acad Sci U S A. 2015 May 19;112(20):6301-6. doi: 10.1073/pnas.1419315112. Epub 2015 May 5. Proc Natl Acad Sci U S A. 2015. PMID: 25944938 Free PMC article.
References
- Discher DE, Janmey P, Wang Y. Tissue cells feel and respond to the stiffness of their substrate. Science. 2005;310:1139–1143. - PubMed
- Vogel V, Sheetz M. Local force and geometry sensing regulate cell functions. Nat Rev Mol Cell Biol. 2006;7:265–275. - PubMed
- Harris AK, Wild P, Stopak D. Silicone rubber substrata: A new wrinkle in the study of cell locomotion. Science. 1980;208:177–179. - PubMed
- Thoumine O, Ott A. Time scale dependent viscoelastic and contractile regimes in fibroblasts probed by microplate manipulation. J Cell Sci. 1997;110:2109–2116. - PubMed
- Micoulet A, Spatz JP, Ott A. Mechanical response analysis and power generation by single–cell stretching. ChemPhysChem. 2005;6:663–670. - PubMed
Publication types
MeSH terms
Substances
LinkOut - more resources
Full Text Sources
Other Literature Sources


