Distinct dynamics of endocytic clathrin-coated pits and coated plaques - PubMed (original) (raw)
Distinct dynamics of endocytic clathrin-coated pits and coated plaques
Saveez Saffarian et al. PLoS Biol. 2009 Sep.
Abstract
Clathrin is the scaffold of a conserved molecular machinery that has evolved to capture membrane patches, which then pinch off to become traffic carriers. These carriers are the principal vehicles of receptor-mediated endocytosis and are the major route of traffic from plasma membrane to endosomes. We report here the use of in vivo imaging data, obtained from spinning disk confocal and total internal reflection fluorescence microscopy, to distinguish between two modes of endocytic clathrin coat formation, which we designate as "coated pits" and "coated plaques." Coated pits are small, rapidly forming structures that deform the underlying membrane by progressive recruitment of clathrin, adaptors, and other regulatory proteins. They ultimately close off and bud inward to form coated vesicles. Coated plaques are longer-lived structures with larger and less sharply curved coats; their clathrin lattices do not close off, but instead move inward from the cell surface shortly before membrane fission. Local remodeling of actin filaments is essential for the formation, inward movement, and dissolution of plaques, but it is not required for normal formation and budding of coated pits in the cells we have studied. We conclude that there are at least two distinct modes of clathrin coat formation at the plasma membrane--classical coated pits and coated plaques--and that these two assemblies interact quite differently with other intracellular structures.
Conflict of interest statement
The authors have declared that no competing interests exist.
Figures
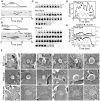
Figure 1. Formation of clathrin-coated structures on the plasma membrane of cells.
(A–E) Time-series images of clathrin assemblies at the top or bottom of Swiss-3T3 cells acquired with a spinning disk confocal microscope (Videos S1 and S2). The fluorescent assemblies were tagged with clathrin LCa-DsRed stably expressed in Swiss-3T3 in the absence (A–D) or presence (E) of transiently expressed auxilin1-EGFP. (A) Representative kymograph obtained from a time series recorded every 5 s (100-ms exposure) for 15 min from the free (top) surface of the cell, showing that the majority of the structures are relatively short-lived. (B) Representative kymograph obtained from a time series recorded every 5 s (100-ms exposure) for 15 min from the adherent (bottom) surface of the cell. All structures are dynamic, but many have longer average lifetimes than those in (A). (C) Selected snapshots from the time series shown in (B) to illustrate examples of clathrin structures displaying the dynamic behavior characteristic of canonical coated pits, of a group of canonical coated pits forming consecutively at a single location (hot spot), and of a plaque. The peak fluorescence intensity of pits assembling in isolation is similar to those forming as part of a hot spot; the overall intensity of the plaque is significantly higher. The acquisition time of each snapshot (in seconds) is indicated. (D) Fluorescence intensity profiles of the clathrin assemblies shown in (C). (E) Fluorescence intensity profiles of clathrin coats tagged with LCa-DsRed and Auxilin1-EGFP to illustrate the dynamics of canonical pits forming in a hot spot and of plaques. A burst of auxilin recruitment coincides with the uncoating step of a canonical pit ,, or with each of the uncoating steps observed within a hot spot; in contrast, variable amounts of auxilin are recruited during the entire life of the plaque, ending with a larger burst. (F) Electron microscopy of clathrin-coated structures on the adherent surface of unroofed BSC1 and HeLa cells. Representative electron micrographs illustrate in (a) the exclusive presence of clathrin-coated pits with various degree of invagination in the plasma membrane of unroofed BSC1 cells; 79 pits were captured in 49 pictures (156 µm2). Representative electron micrographs illustrate in (b and c) the coexistence of clathrin-coated pits and clathrin flat arrays in the plasma membrane of unroofed HeLa cells. 69 pits and 48 sheets were captured in 59 pictures (188 µm2); Bar indicates 100 nm.
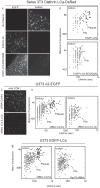
Figure 2. Sizes and lifetimes of clathrin-coated structures forming at the cell surfaces.
In these double logarithmic plots, each dot corresponds to the duration (lifetime) and the corresponding size (maximum fluorescence intensity prior to dissolution) of a clathrin or AP-2 fluorescent spot recorded at the top or bottom plasma membrane of adherent cells. The data derive from time series (100-ms exposures) of at least 15-min duration recorded every 5 s (full circles) or 60-min duration recorded every 10 s (empty circles) using a spinning disk confocal fluorescence microscope. The dots are color coded to distinguish clathrin coats displaying dynamics characteristics of canonical pits (gray) from those behaving as plaques (black). The time series were acquired from Swiss 3T3 stably expressing clathrin LCa-DsRed, or from U373 astrocytes and BSC1 cells stably expressing AP-2 σ2-EGFP. Similar results were obtained from data acquired in two additional Swiss, two additional astrocytes, and two additional BSC1 cells (Figure S4). (A and D) The average lifetime of canonical pits tagged with LCa-DsRed is 62±16 s (n = 19) on the top of the Swiss 3T3 cells and 64±24 s (n = 71) on the bottom; the average lifetime of plaques (bottom only) is longer and more variable (271±141 s; n = 87). The corresponding maximum fluorescence intensities are 1,357±698, 1,130±564, and 2,542±1,784, respectively. The differences in average lifetime or of maximum fluorescence intensity between pits and plaques in Swiss 3T3 cells are statistically significant (p<0.0001) (B, C, and E) The average lifetimes of canonical pits tagged with σ2-EGFP of AP-2 is 60±26 s (n = 34) and 56±19 s (n = 221) on the top and on the bottom of U373 astrocytes, and 56±26 s (n = 105) on the bottom of BSC1 cells. The lifetime of the AP-2 containing plaques on the bottom of astrocytes is 219±112 s (n = 67). The corresponding maximum fluorescence intensities are 932±431, 1,109±428, and 2,542±1,784, respectively. The differences in average lifetime or of maximum fluorescence intensity between pits and plaques in astrocytes are statistically significant (p<0.0001). (F) Effect on clathrin-coat dynamics of actin cytoskeleton depolymerization by 15-min treatment of Swiss 3T3 cells expressing LCa-DsRed with 5 µM latrunculin A. The average lifetime (84±18 sec; n = 12) and maximum fluorescence intensity (1,178±775; n = 41) of the canonical coated pits remains constant, while the number of newly formed pits decreases. In contrast, the plaques became stationary, with average lifetimes in excess of 20 min (p<0.0001), and there is a decrease in the number of newly formed plaques.
Figure 3. Disruption of plaque formation by interference with the function of clathrin light chains.
Loss of plaques upon expression of EFGP-LCb-EED/QQN (A and B) or due to depletion of clathrin light chains or Hip1R by RNAi (C, D, and E). (A) Effective replacement of LCa-DsRed with EGFP-LCb or EFGP-LCb-EED/QQN. Swiss 3T3 cells stably expressing LCa-DsRed were transfected with a modified form of clathrin EGFP-LCb, in which the conserved three critical residues EED required for the interaction of the light chains with Hip1R were mutated to QQN. As control, cells were transfected with no plasmid or with wild-type EGFP-LCb. The fluorescence images show the characteristic punctate pattern of clathrin light chains elicited by the LCa constructs and, due to replacement, the corresponding loss of LCb fluorescence. The estimated replacement level is 85% (n = 170). (B) Expression of EGFP-LCb-EED/QQN prevents formation of plaques, but not of pits. The panels are representative semi-logarithmic plots of maximum fluorescence versus time for pits and plaques from two Swiss 3T3 cells expressing similar amounts of EGFP-LCb or EGFP-LCb-EED/QQN. The average lifetime of canonical pits on the bottom of the Swiss 3T3 cells expressing EGFP-LCb is 106±31 s (n = 45) and 107±31 s (n = 71) in cells expressing EFGP-LCb-EED/QQN. The maximum fluorescence intensities of these pits are 2,131±968 and 2,526±1,392, respectively. The average lifetime and maximum fluorescence intensity of plaques on the bottom of the Swiss 3T3 cells expressing EGFP-LCb are 291±76 s and 3,701±1,451 (n = 27). The differences in average lifetime or in maximum fluorescence intensity between pits and plaques in cells expressing EGFP-LCb is statistically significant (p<0.0001). There is no statistically significant difference in average lifetime or in maximum fluorescence intensity between pits of cells expressing EGFP-LCb or EFGP-LCb-EED/QQN. (C and D) Loss of plaques upon depletion of clathrin light chains. Both clathrin light chains of U373 astrocytes were depleted by transfection with Oligofectamin using a pool of sRNAi specific for the light chains. As control, cells were transfected with Oligofectamin using a scrambled sRNAi sequence (Materials and Methods). (C) The extent of light-chain depletion (∼85%) was estimated using mAb CON.1 immunofluorescence labeling; the mAb recognizes both light chains. (D) The panels are representative semi-logarithm plots of maximum fluorescence versus time for pits and plaques from two different cells containing normal or depleted amounts of clathrin light chains. The average lifetime and maximum fluorescence intensity of the pits in the control cell were 63±23 and 1,562±888 (n = 304), respectively. The average lifetime and maximum fluorescence intensity of the pits in the cell depleted of clathrin light chains were 68±31 and 1,259±589 (n = 168), respectively; the differences are not statistically significant. The average lifetime and maximum fluorescence intensity of the plaques in the control cell were 243±91 and 3,396±1,388 (n = 43), respectively; the differences in average lifetime and in maximum fluorescence intensity between pits and plaques in the control cells are statistically significant (p<0.0001). The plaques are absent in the cell depleted of clathrin light chains. (E) Loss of plaques upon depletion of Hip1R. Hip1R of U373 astrocytes transiently expressing EGFP-LCa were depleted by transfection with Oligofectamin using a pool of sRNAi specific for Hip1R. As control, cells were transfected with Oligofectamin using a scrambled sRNAi sequence (Materials and Methods). The panels are representative semi-logarithmic plots of maximum fluorescence versus time for pits and plaques from two different cells containing normal or depleted amounts of Hip1R. The average lifetime and maximum fluorescence intensity of the pits in the control cell were 58±26 and 1,334±761 (n = 209), respectively. The average lifetime and maximum fluorescence intensity of the pits in the cell depleted of Hip1R were 56±27 and 866±570 (n = 237), respectively; the differences are not statistically significant. The average lifetime and maximum fluorescence intensity of the plaques in the control cell were 194±47 and 2,840±1,133 (n = 36), respectively; the differences in average lifetime and in maximum fluorescence intensity between pits and plaques in the control cells are statistically significant (p<0.0001). Plaques are absent in the cell depleted of Hip1R.
Figure 4. Increase of cell motility correlates with loss of plaques.
(A) Expression in U373 astrocytes of EGFP-LCb-EED/QQN prevents plaque formation. U373 astrocytes were transfected with EGFP-LCb-EED/QQN or with EGFP-LCb as control, and their clathrin structures imaged 48 h after transfection. The semilogarithmic plots represent maximum fluorescence versus time of pits and plaques from two cells expressing similar amounts of EGFP-LCb or EGFP-LCb-EED/QQN. The average lifetimes are 69±23 s (n = 129) for canonical pits tagged with EGFP-LCb is and 232±78 s (n = 30) for plaques; the corresponding fluorescence intensity maxima are 1,420±536 and 2,087±455, respectively. The difference in maximum fluorescence intensity is statistically significant (p<0.0001). The right panels are snapshots from two different time points of a video acquired from cells expressing EGFP-LCb-EED/QQN using the WF fluorescence combined with bright-field phase illumination; the images show the elongated shape of the cells and the change in their position. Control cells (unpublished data) are more symmetric and remain stationary. (B) Increased motility of cells correlates with absence of plaques. Each panel shows four motility tracks, each from a different cell that either expresses its endogenous clathrin light chains (not transfected), or where they have been replaced, by overexpression, with EGFP-LCb or EGFP-LCb-EED/QQN.
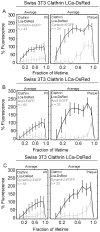
Figure 5. Recruitment of cortactin, Arp2/3, and dynamin into clathrin-coated pits and plaques.
Spinning disk fluorescence intensity profiles obtained from time-series images of clathrin assemblies forming at the adherent (bottom) surface of Swiss 3T3 fibroblasts stably expressing Clathrin LCa-DsRed and transiently expressing (A) cortactin-EGFP, (B) Arp3-EGFP, and (C) dynamin2-EGFP. Fluorescence images for each set of these proteins were simultaneously acquired with a beam splitter using 200-ms exposures obtained every 5 s. The points represent averages of complete datasets, normalized to the maximum intensity and to the lifetime of the object. Each point represents average plus or minus standard deviation. N is the number of coated pits and plaques analyzed. The maximum recruitments of clathrin LCa-DsRed, cortactin-EGFP, Arp3-EGFP, or dynamin2-EGFP by plaques are statistically higher (p<0.0001) than recruitment by pits.
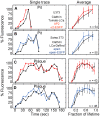
Figure 6. Movement of clathrin-coated pits and coated plaques into the cell interior.
(A and B) Fluorescence intensity profile from a single canonical coated pit (A) or coated plaque (B) acquired from a Swiss 3T3 cells stably expressing clathrin LCa-DsRed by alternating TIR and WF illumination. The clathrin structures were imaged as they assembled on the bottom surface of the cell in direct contact with the coverslip. The TIR/WF cycles were acquired at 10-s intervals using exposures of 200 and 1,000 msec taken 200 ms apart. The WF fluorescence plot was normalized to its maximum fluorescence value to correct for variations in the intensity, whereas the TIR signals were normalized to that of the WF at the early stages of coat formation but allowed to diverge as the coat was formed. This corrects for differences in illumination and number of fluorophores in the spot . Stars denote the endpoint used to calculate the lifetime. (C) Summary of TIR and WF data collected from all plaques during the last 40 s before their dissolution, with both datasets normalized to their corresponding maximum intensity, as in the work of Merrifield et al. ; each time point represents the average plus or minus the standard deviation (n = 40 plaques). (D and E) The average axial position (z, nm) for the ensemble of clathrin LCa-DsRed captured in the coat of pits (D) or plaques (E), plotted as a function of their respective lifetimes as calculated using,  with an evanescent TIR field penetration of 90 nm determined experimentally . Each point represents the average plus or minus the standard deviation for all pits (n = 51) and plaques (n = 40). The coats of canonical pits shift continuously inward as they assemble, whereas plaques move abruptly inwards only just before dissolution. (F) The average axial position (displacement just before dissolution) of the clathrin plaques as calculated from average intensities presented in (C) using the same equation as in (E). This method of calculation is identical to the one used in Merrifield et al. ; using this method, we detect a similar movement away from the surface at the end of the plaque lifetime, as shown in (E).
Figure 7. Relative positions of clathrin, AP-2, and epsin in coated pits and plaques.
(A) Models representing the distribution of clathrin, AP-2, and epsin during the formation of a canonical clathrin-coated pit or a clathrin-coated plaque. (B) Difference in the axial positions of clathrin Tomato-LCa or clathrin LCa-DsRed with respect to AP-2 σ2-EGFP (Δ_z_, red) or to epsin1-EGFP (Δ_z_, blue) determined for individual pits or plaques selected for DiNa analysis in U373 astrocytes (52 pits and 40 plaques) or Swiss 3T3 fibroblasts (49 pits and 45 plaques) cells. The difference of axial position within each pit is plotted as a function of time; to facilitate the comparison between pits of different lifetimes, the time component is normalized as a fraction of each lifetime. DiNa results were obtained from data acquired three Swiss and three U373 astrocytes. The axial separations become statistically significant (p<0.0001) when the pits reach a maturity of 50% or more. (C) Difference in the axial position of clathrin Tomato-LCa with respect to AP-2 σ2-EGFP (Δ_z_, red) or to epsin1-EGFP (Δ_z_, blue) determined for 15 and 14 individual pits selected for DiNa analysis in BSC1 cells, respectively. Similar DiNa results were obtained from data acquired in three additional Swiss and three additional astrocytes (unpublished data). Error bars in (B) and (C) indicate plus or minus the standard deviation.
Figure 8. Recruitment of AP-2 and epsin into clathrin-coated pits and plaques.
WF fluorescence intensity profiles obtained from time-series images of clathrin assemblies forming at the bottom surface of cells using 1-s simultaneous exposure with 10-s intervals. The data were obtained from (A and C) U373 astrocytes stably expressing AP-2 σ2-EGFP and transiently expressing Tomato-LCa, or (B and D) Swiss 3T3 fibroblasts stably expressing Clathrin LCa-DsRed and transiently expressing epsin1-EGFP. Left panels represent examples from single pits or plaques as a function of time. Right panels represent averages from the complete data sets normalized to the length of each lifetime. Each point represents average plus or minus the standard deviation; the data from the astrocytes presented in (A) and (C) were obtained from the three cells; the data from the fibroblasts presented in (B) and (D) are also from three cells; n is the number of analyzed pits and plaques.
Figure 9. Models representing the sequential formation of a clathrin-coated pit and a coated plaque.
Coated pits are small, rapidly forming structures that by progressive recruitment of clathrin, adaptors, and other regulatory proteins deform the underlying membrane as they bud inward to form coated vesicles. Coated plaques are larger, less dynamic, and relatively planar structures that move uniformly inward from the cell surface shortly before the membrane pinches off. Presence and/or remodeling of the actin cytoskeleton is essential for the formation, inward movement, and dissolution of clathrin-coated plaques, but it is not required for formation and budding of the rapidly growing clathrin-coated pits.
Comment in
- Clathrin couture: fashioning distinctive membrane coats at the cell surface.
Traub LM. Traub LM. PLoS Biol. 2009 Sep;7(9):e1000192. doi: 10.1371/journal.pbio.1000192. Epub 2009 Sep 8. PLoS Biol. 2009. PMID: 19809570 Free PMC article. No abstract available.
Similar articles
- Cortactin is a component of clathrin-coated pits and participates in receptor-mediated endocytosis.
Cao H, Orth JD, Chen J, Weller SG, Heuser JE, McNiven MA. Cao H, et al. Mol Cell Biol. 2003 Mar;23(6):2162-70. doi: 10.1128/MCB.23.6.2162-2170.2003. Mol Cell Biol. 2003. PMID: 12612086 Free PMC article. - Imaging actin and dynamin recruitment during invagination of single clathrin-coated pits.
Merrifield CJ, Feldman ME, Wan L, Almers W. Merrifield CJ, et al. Nat Cell Biol. 2002 Sep;4(9):691-8. doi: 10.1038/ncb837. Nat Cell Biol. 2002. PMID: 12198492 - Coupling between clathrin-dependent endocytic budding and F-BAR-dependent tubulation in a cell-free system.
Wu M, Huang B, Graham M, Raimondi A, Heuser JE, Zhuang X, De Camilli P. Wu M, et al. Nat Cell Biol. 2010 Sep;12(9):902-8. doi: 10.1038/ncb2094. Epub 2010 Aug 22. Nat Cell Biol. 2010. PMID: 20729836 Free PMC article. - Molecular structure, function, and dynamics of clathrin-mediated membrane traffic.
Kirchhausen T, Owen D, Harrison SC. Kirchhausen T, et al. Cold Spring Harb Perspect Biol. 2014 May 1;6(5):a016725. doi: 10.1101/cshperspect.a016725. Cold Spring Harb Perspect Biol. 2014. PMID: 24789820 Free PMC article. Review. - Clathrin coated pits, plaques and adhesion.
Lampe M, Vassilopoulos S, Merrifield C. Lampe M, et al. J Struct Biol. 2016 Oct;196(1):48-56. doi: 10.1016/j.jsb.2016.07.009. Epub 2016 Jul 16. J Struct Biol. 2016. PMID: 27431447 Review.
Cited by
- Phosphoinositides in the mammalian endo-lysosomal network.
Cullen PJ, Carlton JG. Cullen PJ, et al. Subcell Biochem. 2012;59:65-110. doi: 10.1007/978-94-007-3015-1_3. Subcell Biochem. 2012. PMID: 22374088 Free PMC article. Review. - Live-cell imaging of clathrin coats.
Kural C, Kirchhausen T. Kural C, et al. Methods Enzymol. 2012;505:59-80. doi: 10.1016/B978-0-12-388448-0.00012-7. Methods Enzymol. 2012. PMID: 22289448 Free PMC article. - Phosphorylation on Ser-279 and Ser-282 of connexin43 regulates endocytosis and gap junction assembly in pancreatic cancer cells.
Johnson KE, Mitra S, Katoch P, Kelsey LS, Johnson KR, Mehta PP. Johnson KE, et al. Mol Biol Cell. 2013 Mar;24(6):715-33. doi: 10.1091/mbc.E12-07-0537. Epub 2013 Jan 30. Mol Biol Cell. 2013. PMID: 23363606 Free PMC article. - Imaging endocytic vesicle formation at high spatial and temporal resolutions with the pulsed-pH protocol.
Sposini S, Rosendale M, Claverie L, Van TNN, Jullié D, Perrais D. Sposini S, et al. Nat Protoc. 2020 Sep;15(9):3088-3104. doi: 10.1038/s41596-020-0371-z. Epub 2020 Aug 17. Nat Protoc. 2020. PMID: 32807908 - Mechanistic divergences of endocytic clathrin-coated vesicle formation in mammals, yeasts and plants.
Johnson A. Johnson A. J Cell Sci. 2024 Aug 15;137(16):jcs261847. doi: 10.1242/jcs.261847. Epub 2024 Aug 20. J Cell Sci. 2024. PMID: 39161994 Free PMC article. Review.
References
- Brett T. J, Traub L. M. Molecular structures of coat and coat-associated proteins: function follows form. Curr Opin Cell Biol. 2006;18:1–12. - PubMed
- Conner S. D, Schmid S. L. Regulated portals of entry into the cell. Nature. 2003;422:37. - PubMed
- Kirchhausen T. Clathrin. Ann Rev Biochem. 2000;69:699–727. - PubMed
- Kaksonen M, Toret C. P, Drubin D. G. A modular design for the clathrin- and actin-mediated endocytosis machinery. Cell. 2005;123:305–320. - PubMed
- Ehrlich M, Boll W, van Oijen A, Hariharan R, Chandran K, et al. Endocytosis by random initiation and stabilization of clathrin-coated pits. Cell. 2004;118:591–605. - PubMed
Publication types
MeSH terms
Substances
LinkOut - more resources
Full Text Sources
Other Literature Sources


