Sodium benzoate, a metabolite of cinnamon and a food additive, reduces microglial and astroglial inflammatory responses - PubMed (original) (raw)
Sodium benzoate, a metabolite of cinnamon and a food additive, reduces microglial and astroglial inflammatory responses
Saurav Brahmachari et al. J Immunol. 2009.
Abstract
Upon activation, microglia and astrocytes produce a number of proinflammatory molecules that participate in the pathophysiology of several neurodegenerative disorders. This study explores the anti-inflammatory property of cinnamon metabolite sodium benzoate (NaB) in microglia and astrocytes. NaB, but not sodium formate, was found to inhibit LPS-induced expression of inducible NO synthase (iNOS), proinflammatory cytokines (TNF-alpha and IL-1beta) and surface markers (CD11b, CD11c, and CD68) in mouse microglia. Similarly, NaB also inhibited fibrillar amyloid beta (Abeta)-, prion peptide-, double-stranded RNA (polyinosinic-polycytidylic acid)-, HIV-1 Tat-, 1-methyl-4-phenylpyridinium(+)-, IL-1beta-, and IL-12 p40(2)-induced microglial expression of iNOS. In addition to microglia, NaB also suppressed the expression of iNOS in mouse peritoneal macrophages and primary human astrocytes. Inhibition of NF-kappaB activation by NaB suggests that NaB exerts its anti-inflammatory effect through the inhibition of NF-kappaB. Although NaB reduced the level of cholesterol in vivo in mice, reversal of the inhibitory effect of NaB on iNOS expression, and NF-kappaB activation by hydroxymethylglutaryl-CoA, mevalonate, and farnesyl pyrophosphate, but not cholesterol and ubiquinone, suggests that depletion of intermediates, but not end products, of the mevalonate pathway is involved in the anti-inflammatory effect of NaB. Furthermore, we demonstrate that an inhibitor of p21(ras) farnesyl protein transferase suppressed the expression of iNOS, that activation of p21(ras) alone was sufficient to induce the expression of iNOS, and that NaB suppressed the activation of p21(ras) in microglia. These results highlight a novel anti-inflammatory role of NaB via modulation of the mevalonate pathway and p21(ras).
Conflict of interest statement
Disclosures: The authors have no financial conflict of interest.
Figures
FIGURE 1
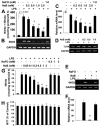
Dose-dependent inhibition of LPS-induced NO production by NaB, but not NaFO, in mouse microglia. Mouse BV-2 microglial cells were treated with different concentrations of NaB and NaFO for 6 h followed by stimulation with LPS under serum-free condition. A, After 24 h of stimulation, concentrations of total NO (nitrate plus nitrite) were measured in supernatants. After 5 h of stimulation, the expression of iNOS mRNA was monitored by semiquantitative RT-PCR (B) and real-time PCR (C). D, The expression of TLR4 was monitored by semiquantitative RT-PCR. Mouse peritoneal macrophages isolated by peritoneal lavage were treated with NaB (1 mM) or NaFO (1 mM) for 5 h followed by stimulation with LPS. After 6 h of stimulation, the mRNA expression of iNOS was monitored by semiquantitative RT-PCR (E) and real-time PCR (F). Primary microglia isolated from 7- to 9-day-old mouse pups were treated with different concentrations of NaB and NaFO for 6 h followed by stimulation with LPS under serum-free conditions. After 24 h of stimulation, concentration of nitrite (G) was measured in supernatants. H, Cell viability was assayed by MTT. Results are means ± SD of three different experiments. b, p < 0.05 vs LPS; a, p < 0.001 vs LPS.
FIGURE 2
NaB, but not NaFO, inhibits LPS-induced expression of proinflammatory cytokines in mouse BV-2 microglial cells. Cells were treated with different concentrations of NaB and NaFO for 6 h followed by stimulation with 1 μ_g/ml LPS under serum-free condition. A, After 24 h of stimulation, concentrations of TNF-α and IL-1_β were measured in supernatants by ELISA. Results are means ± SD of three different experiments. b, p < 0.05 vs LPS-TNF; a, p < 0.001 vs LPS-TNF; c, p < 0.05 vs LPS-IL-1; d, p < 0.001 vs LPS-IL-1. After 5 h of stimulation, the mRNA expression of TNF-α and IL-1_β_ was monitored by semiquantitative RT-PCR (B) and real-time PCR (C). a, p < 0.001 vs LPS.
FIGURE 3
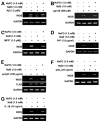
Effect of NaB and NaFO on A_β_-, HIV-1 gp120-, MPP+-, PrP-, poly(IC)-, IL-1_β_ p402, and IL-12 p402-induced expression of iNOS in mouse BV-2 microglial cells. Cells preincubated with NaB (1 mM) or NaFO (1 mM) for 6 h were stimulated with 1 _μ_M A_β_1–42 (A), 200 pg/ml gp120 (B), 1 _μ_M MPP+ (C), 1 _μ_g/ml PrP (D), 100 μ_g/ml poly(IC) (E), 20 ng/ml p402 (F), or 10 ng/ml IL-1_β (G) under serum-free condition. After 5 h of stimulation, the expression of iNOS mRNA (A–G) and TLR3 mRNA (E) was analyzed in microglial cells by semiquantitative RT-PCR. Results represent three independent experiments.
FIGURE 4
NaB, but not NaFO, inhibits the expression of surface markers, MHC class II, and costimulatory molecules in activated microglia. BV-2 microglial cells were treated with NaB and NaFO for 6 h followed by stimulation with 1 _μ_g/ml LPS under serum-free conditions. A, After 24 h of stimulation, the expressions of CD11b, CD11c, CD68, B7-2, B7-1, and MHC class II were monitored by semiquantitative RT-PCR. B, Primary mouse microglia were treated with NaB followed by stimulation with 1 _μ_M MPP+. After 24 h of stimulation, levels of CD11b and iNOS were monitored by double-label immunofluorescence. Cells were incubated with appropriately diluted FITC-conjugated CD11b (C) or CD68 (D) followed by FACS. The percentage of cells in the indicated quadrant has been mentioned. Results are means ± SD of three different trials.
FIGURE 5
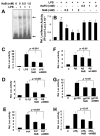
NaB attenuates activation of NF-_κ_B in mouse BV-2 microglial cells. A, Cells were treated with different concentrations of NaB for 6 h followed by stimulation with 1 _μ_g/ml LPS under serum-free conditions. After 1 h of stimulation, the DNA-binding activity of NF-_κ_B was monitored. B, Cells plated in 12-well plates were cotransfected with 0.25 _μ_g of PBIIX-Luc (an NF-_κ_B-dependent reporter construct) and 12.5 ng of pRL-TK. Twenty-four hours after transfection, cells received different concentrations of NaB and NaFO. After 6 h of incubation, cells were stimulated with LPS for 6 h under serum-free condition. Firefly (ff-Luc) and Renilla luciferase (r-Luc) activities were obtained by analyzing the total cell extract. C–H, Twenty-four hours after transfection, cells received NaB (1 mM); 1 h before stimulation, cells were treated with wtNBD (10 _μ_M). After 6 h of incubation with NaB, cell were stimulated with LPS (1 μ_g/ml; C), IL-1_β (10 ng/ml; D), PrP (1 μ_g/ml; E), A_β (1 _μ_M; F), gp120 (200 pg/ml; G), or p402 (20 ng/ml; H). Firefly and Renilla luciferase activities were obtained by analyzing the total cell extract. Results are means ± SD of three different experiments. a, p < 0.001 vs control; b, p < 0.05 vs LPS; c, p < 0.001 vs LPS.
FIGURE 6
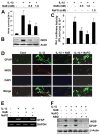
NaB inhibits IL-1_β_-induced expression of iNOS and the activation of human iNOS promoter in primary human astrocytes. Cells pretreated with different concentrations of NaB for 6 h were stimulated with 20 ng/ml IL-1_β_. After 48 h of stimulation, the level of nitrite was measured by Griess reagent (A) and the level of iNOS protein was monitored by Western blot (B). Actin was run as control. a, p < 0.001 vs IL-1_β. C_, Cells plated at 70–80% confluence in 12-well plates were cotransfected with 0.25 μ_g of phiNOS(7.2)Luc and 12.5 ng of pRL-TK using the Lipofectamine-Plus (Invitrogen). Twenty-four hours after transfection, cells received NaB and NaFO. After 6 h of incubation, cells were stimulated with IL-1_β (20 ng/ml) for 12 h under serum-free condition. Firefly (ff-Luc) and Renilla (r-Luc) luciferase activities were obtained by analyzing the total cell extract. Data are means ± SD of three different experiments. a, p < 0.001 vs control; b, p < 0.001 vs IL-1_β_. Primary human astroglia were treated with NaB (1 mM) and NaFO (1 mM) for 6 h followed by stimulation with IL-1_β_ (20 ng/ml). After 24 h of stimulation, mRNA expression of GFAP was examined by semiquantitative RT-PCR (E), and protein expression of GFAP and iNOS was monitored by double-label immunofluorescence (D). Cells pretreated with appropriate concentrations of NaB or NaFO for 6 h or wtNBD (10 μ_M) alone or along with NaB for 1 h were stimulated with 20 ng/ml IL-1_β under serum-free conditions. After 48 h of stimulation, the level of iNOS and GFAP proteins was monitored by Western blot (F). _β_-Actin was run as control Results represent three independent experiments.
FIGURE 7
Effect of NaB on serum level of cholesterol in male C57BL/6 mice. Mice (6–8 wk old) were treated with NaB (100 mg/kg body weight), NaFO (100 mg/kg body weight), and pravastatin (1 mg/kg body weight) separately via gavage for 7 days followed by quantification of cholesterol in serum using a simple fluorometric method. Results represent means ± SD of five mice per group (n = 5). b, p < 0.05 vs control.
FIGURE 8
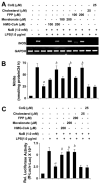
Intermediates of the mevalonate pathway negate the inhibitory effect of NaB on the expression of iNOS and the activation of NF-_κ_B in mouse BV-2 microglial cells. Cells were treated with NaB in the presence or absence of different concentrations of HMG-CoA, mevalonate, FPP, cholesterol, and ubiquinone for 6 h followed by stimulation with LPS. A, After 5 h of stimulation, the expression of iNOS mRNA was monitored by RT-PCR. B, After 24 h of stimulation, the level of nitrite was measured in supernatants using Griess reagent. Results are means ± SD of three independent experiments. a, p < 0.001 vs LPS; b, p < 0.001 vs LPS+NaB. C, Cells were cotransfected with 0.25 _μ_g of PBIIX-Luc and 12.5 ng of pRL-TK. Twenty-four hours after transfection, cells were incubated with NaB in the presence or absence of HMG-CoA, mevalonate, FPP, cholesterol, and ubiquinone. After 6 h of incubation, cells were stimulated with LPS for 6 h followed by assay of firefly (ff-Luc) and Renilla (r-Luc) luciferase activities. Results are means ± SD of three different experiments. a, p < 0.001 vs LPS; b, p < 0.001 vs LPS plus NaB.
FIGURE 9
Effect of FPT inhibitor II (FPTI II) on the expression of iNOS and the activation of NF-_κ_B in mouse BV-2 microglial cells. A, Cells treated with different concentrations of FPT inhibitor II for 2 h were stimulated by LPS. After 5 h of stimulation, the expression of iNOS mRNA was monitored by RT-PCR. B, Cells were cotransfected with 0.25 _μ_g of PBIIX-Luc and 12.5 ng of pRL-TK. Twenty-four hours after transfection, cells were incubated with different concentrations of FPT inhibitor II for 2 h followed by stimulation with LPS. After 6 h of stimulation, activities of firefly (ff-Luc) and Renilla (r-Luc) luciferase were monitored. Results are mean ± S.D. of three different experiments. a, p < 0.001 vs LPS; b, p < 0.05 vs LPS. C–E, Cells treated with appropriate concentrations of FPT inhibitor II (200 _μ_M) for 2 h (C), FPP (200 _μ_M; D), or NaB (1 mM; E) alone for 6 h or along with wtNBD (10 _μ_M; 1 h before stimulation) were stimulated by LPS. After 5 h of stimulation, the expression of iNOS mRNA was monitored by RT-PCR. F, Cells treated with different concentrations of NaB for 6 h were stimulated by IFN-γ (12.5 U/ml). After 5 h of stimulation, the expression of iNOS mRNA was monitored by RT-PCR. The results represent three independent experiments.
FIGURE 10
Effect of NaB on the activation of p21_ras_ in mouse BV-2 microglial cells. A, Cells were stimulated with LPS under serum-free conditions. At different time points, activation of p21_ras_ was monitored. B, In another set, cells pretreated with 1 mM NaB/NaFO for 6 h were challenged with LPS under serum-free conditions followed by monitoring activation of p21_ras_ at 3 min of stimulation. Results represent two independent experiments.
FIGURE 11
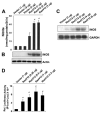
Activation of p21_ras_ alone induces the expression of iNOS and the activation of NF-κ_B in mouse BV-2 microglial cells. Cells were transfected with different concentrations of an empty vector and RasV12 (constitutively active mutant of Ras). Twenty-four hours after transfection, cells were incubated in serum-free medium for 24 h followed by assay of nitrite concentration in supernatant (A) and monitoring the level of iNOS protein in cells by Western blot (B). Actin was run as control. a, p < 0.001 vs IL-1_β. C, Cells plated at 70–80% confluence in 12-well plates were cotransfected with 0.25 μ_g of phiNOS(7.2)Luc and 12.5 ng of pRL-TK using the Lipofectamine-Plus (Invitrogen). Twenty-four hours after transfection, cells received NaB and NaFO. After 6 h of incubation, cells were stimulated with IL-1_β (20 ng/ml) for 12 h under serum-free condition. Firefly (ff-Luc) and Renilla (r-Luc) luciferase activities were obtained by analyzing the total cell extract as described in Materials and Methods. Data are means ± SD of three different experiments. a, p < 0.001 vs control; b, p < 0.001 vs IL-1_β_.
Similar articles
- Sodium benzoate, a metabolite of cinnamon and a food additive, upregulates neuroprotective Parkinson disease protein DJ-1 in astrocytes and neurons.
Khasnavis S, Pahan K. Khasnavis S, et al. J Neuroimmune Pharmacol. 2012 Jun;7(2):424-35. doi: 10.1007/s11481-011-9286-3. Epub 2011 Jun 24. J Neuroimmune Pharmacol. 2012. PMID: 21701815 Free PMC article. - Lovastatin and phenylacetate inhibit the induction of nitric oxide synthase and cytokines in rat primary astrocytes, microglia, and macrophages.
Pahan K, Sheikh FG, Namboodiri AM, Singh I. Pahan K, et al. J Clin Invest. 1997 Dec 1;100(11):2671-9. doi: 10.1172/JCI119812. J Clin Invest. 1997. PMID: 9389730 Free PMC article. - Involvement of phosphatidylinositol 3-kinase-mediated up-regulation of I kappa B alpha in anti-inflammatory effect of gemfibrozil in microglia.
Jana M, Jana A, Liu X, Ghosh S, Pahan K. Jana M, et al. J Immunol. 2007 Sep 15;179(6):4142-52. doi: 10.4049/jimmunol.179.6.4142. J Immunol. 2007. PMID: 17785853 Free PMC article. - Cinnamon and Its Metabolite Sodium Benzoate Attenuate the Activation of p21rac and Protect Memory and Learning in an Animal Model of Alzheimer's Disease.
Modi KK, Roy A, Brahmachari S, Rangasamy SB, Pahan K. Modi KK, et al. PLoS One. 2015 Jun 23;10(6):e0130398. doi: 10.1371/journal.pone.0130398. eCollection 2015. PLoS One. 2015. PMID: 26102198 Free PMC article. - Sodium Benzoate, a Metabolite of Cinnamon and a Food Additive, Upregulates Ciliary Neurotrophic Factor in Astrocytes and Oligodendrocytes.
Modi KK, Jana M, Mondal S, Pahan K. Modi KK, et al. Neurochem Res. 2015 Nov;40(11):2333-47. doi: 10.1007/s11064-015-1723-x. Epub 2015 Sep 23. Neurochem Res. 2015. PMID: 26399250 Free PMC article.
Cited by
- Add-on Sodium Benzoate and _N_-Acetylcysteine in Patients With Early Schizophrenia Spectrum Disorder: A Multicenter, Double-Blind, Randomized Placebo-Controlled Feasibility Trial.
Husain MO, Chaudhry IB, Khoso AB, Husain MI, Ansari MA, Mehmood N, Naqvi HA, Nizami AT, Talib U, Rajput AH, Bassett P, Foussias G, Deakin B, Husain N. Husain MO, et al. Schizophr Bull Open. 2024 Feb 9;5(1):sgae004. doi: 10.1093/schizbullopen/sgae004. eCollection 2024 Jan. Schizophr Bull Open. 2024. PMID: 39144112 Free PMC article. - Carrageenan in the Diet: Friend or Foe for Inflammatory Bowel Disease?
Kimilu N, Gładyś-Cieszyńska K, Pieszko M, Mańkowska-Wierzbicka D, Folwarski M. Kimilu N, et al. Nutrients. 2024 Jun 6;16(11):1780. doi: 10.3390/nu16111780. Nutrients. 2024. PMID: 38892712 Free PMC article. Review. - Therapeutic effects of oral benzoic acid application during acute murine campylobacteriosis.
Du K, Mousavi S, Foote MS, Bereswill S, Heimesaat MM. Du K, et al. Eur J Microbiol Immunol (Bp). 2024 May 27;14(3):243-260. doi: 10.1556/1886.2024.00059. Print 2024 Sep 11. Eur J Microbiol Immunol (Bp). 2024. PMID: 38801662 Free PMC article. - Diet and disease-related outcomes in multiple sclerosis: A systematic review of clinical trials.
Harirchian MH, Karimi E, Bitarafan S. Harirchian MH, et al. Curr J Neurol. 2022 Jan 5;21(1):52-63. doi: 10.18502/cjn.v21i1.9362. Curr J Neurol. 2022. PMID: 38011464 Free PMC article. Review. - Elucidating the Mechanisms of Sodium Benzoate in Alzheimer Disease: Insights from Quantitative Proteomics Analysis of Serum Samples.
Lin CH, Liao HY, Lane HY, Chen CJ. Lin CH, et al. Int J Neuropsychopharmacol. 2023 Dec 18;26(12):856-866. doi: 10.1093/ijnp/pyad061. Int J Neuropsychopharmacol. 2023. PMID: 37875373 Free PMC article.
References
- Gonzalez-Scarano F, Baltuch G. Microglia as mediators of inflammatory and degenerative diseases. Annu Rev Neurosci. 1999;22:219–240. - PubMed
- Nagele RG, Wegiel J, Venkataraman V, Imaki H, Wang KC, Wegiel J. Contribution of glial cells to the development of amyloid plaques in Alzheimer's disease. Neurobiol Aging. 2004;25:663–674. - PubMed
- Barcia C, Sanchez Bahillo A, Fernandez-Villalba E, Bautista V, Poza Y Poza M, Fernandez-Barreiro A, Hirsch EC, Herrero MT. Evidence of active microglia in substantia nigra pars compacta of parkinsonian monkeys 1 year after MPTP exposure. Glia. 2004;46:402–409. - PubMed
- Dauer W, Przedborski S. Parkinson's disease: mechanisms and models. Neuron. 2003;39:889–909. - PubMed
Publication types
MeSH terms
Substances
LinkOut - more resources
Full Text Sources
Other Literature Sources
Research Materials
