Alpha-tocopherol beta-oxidation localized to rat liver mitochondria - PubMed (original) (raw)
Alpha-tocopherol beta-oxidation localized to rat liver mitochondria
Debbie J Mustacich et al. Free Radic Biol Med. 2010.
Abstract
Approximately 40% of Americans take dietary supplements, including vitamin E (alpha-tocopherol). Unlike other fat-soluble vitamins, alpha-tocopherol is not accumulated to toxic levels. Rather tissue levels are tightly regulated, in part via increased hepatic metabolism and excretion that could, theoretically, alter metabolism of drugs, environmental toxins, and other nutrients. To date, in vivo subcellular location(s) of alpha-tocopherol metabolism have not been identified. The proposed pathway of alpha-tocopherol metabolism proceeds via omega-hydroxylation to 13'-OH-alpha-tocopherol, followed by successive rounds of beta-oxidation to form alpha-CEHC. To test the hypothesis that alpha-tocopherol omega-hydroxylation occurs in microsomes while beta-oxidation occurs in peroxisomes, rats received daily injections of vehicle, 10 mg alpha-tocopherol, or 10 mg trolox/100 g body wt for 3 days, and then microsomes, mitochondria, and peroxisomes were isolated from liver homogenates. Homogenate alpha-tocopherol levels increased 16-fold in alpha-tocopherol-injected rats, while remaining unchanged in trolox- or vehicle-injected rats. Total alpha-tocopherol recovered in the three subcellular fractions represented 93+/-4% of homogenate alpha-tocopherol levels. In alpha-tocopherol-injected rats, microsome alpha-tocopherol levels increased 28-fold, while mitochondria and peroxisome levels increased 8- and 3-fold, respectively, indicating greater partitioning of alpha-tocopherol to the microsomes with increasing liver alpha-tocopherol. In alpha-tocopherol-injected rats, microsome 13'-OH-alpha-tocopherol levels increased 24-fold compared to controls, and were 7-fold greater than 13'-OH-alpha-tocopherol levels in peroxisome and mitochondrial fractions of alpha-tocopherol-injected rats. An unexpected finding was that alpha-CEHC, the end product of alpha-tocopherol metabolism, was found almost exclusively in mitochondria. These data are the first to indicate a mitochondrial role in alpha-tocopherol metabolism.
Copyright 2009 Elsevier Inc. All rights reserved.
Figures
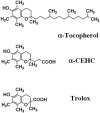
Fig. 1
Chemical structures of α-tocopherol, α-CEHC and trolox.
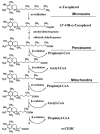
Fig. 2
Pristanic acid β-oxidation utilizes both peroxisomes and mitochondria. [15, 17]. *Note the similarities between pristanic acid and the phytyl tail of α-tocopherol.
Fig. 3
Liver and plasma α-tocopherol concentrations in response to subcutaneous (SQ) vehicle, α-tocopherol or trolox injections. α-Tocopherol concentrations in (A) Liver and (B) Plasma. Rats (n = 6/group) received daily SQ injections of vehicle (saline), α-tocopherol or trolox for 3 days. On day 4, following a 12 h fast, rats were killed, blood collected and livers perfused with 0.9% saline (containing 2 U/ml heparin) using a perfusion catheter inserted into the heart. Livers were excised, aliquots frozen in liquid N2 and stored at −80°C. α-Tocopherol concentrations were determined as described in the methods. Liver α-tocopherol was determined per gram of liver and expressed here per total liver in order to facilitate comparison with homogenate and subfraction α-tocopherol levels (Figure 6) and determine recovery of liver α-tocopherol during the homogenation and subfractionation procedure. All values are expressed as mean ± SE, n = 6, with * = p < 0.01 as compared with vehicle-injected rats (see methods).
Fig. 4
Liver and plasma α-CEHC concentrations in response to SQ vehicle, α-tocopherol and trolox injections. α-CEHC concentrations in (A) Liver and (B) Plasma were determined from SQ vehicle-, α-tocopherol and trolox-injected rats, as described in Figure 3 and the methods. Liver α-CEHC was determined per gram of liver and expressed here per total liver in order to facilitate comparison with homogenate and subfraction α-CEHC levels (Figure 7) and determine recovery of liver α-CEHC during the homogenation and subfractionation procedure. All values are expressed as mean ± SE, n = 6, with * = p < 0.01 as compared with vehicle-injected rats (see methods).
Fig. 5
Hepatic homogenate, microsome, mitochondria and peroxisome fraction α-tocopherol concentrations in response to SQ vehicle, α-tocopherol and trolox injections. (A) Total α-tocopherol and (B) Percent homogenate α-tocopherol levels determined for homogenates, microsomes, mitochondria and peroxisomes from SQ vehicle-, α-tocopherol and trolox-injected rats, as described in the methods. Total α-tocopherol is expressed as total nmol per homogenate or subfraction calculated using concentration of α-tocopherol (nmol/g), starting amount of liver (g), total volume of homogenate (ml), volume of homogenate used for fractionation (ml) and final volume used to suspend subfraction pellets. All values are expressed as mean ± SE, n = 6, with * = p < 0.01 as compared with vehicle-injected rats (see methods).
Fig. 6
Hepatic homogenate, microsome, mitochondria and peroxisome fraction 13′-OH-α-Tocopherol levels in response to SQ vehicle, α-tocopherol and trolox injections. (A) Total 13′-OH-α-tocopherol and (B) Percent homogenate 13′-OH-α-tocopherol were determined from SQ vehicle-, α-tocopherol and trolox-injected rats, as described in the methods. Total 13′-OH-α-tocopherol is expressed as total nmol using concentration of 13′-OH-α-tocopherol (nmol/g), starting amount of liver (g), total volume of homogenate (ml), volume of homogenate used for fractionation (ml) and final volume used to suspend subfraction pellets. All values are expressed as mean ± SE, n = 6, with * = p < 0.01 as compared with vehicle-injected rats (see methods)
Fig. 7
Hepatic homogenate, microsome, mitochondria and peroxisome fraction α-CEHC levels in response to SQ vehicle, α-tocopherol and trolox injections. Total α-CEHC is expressed as total nmol calculated using concentration of α-CEHC (nmol/g), starting amount of liver (g), total volume of homogenate (ml), volume of homogenate used for fractionation (ml) and final volume used to suspend subcellular fraction pellets. All values are expressed as mean ± SE, n = 6, with * = p < 0.01 as compared with vehicle-injected rats (see methods).
Fig. 8
Single-quadrupole mass spectral data of α-CEHC in mitochondria and peroxisomes in response to SQ vehicle and α-tocopherol injections. Trolox was added to subcellular fraction samples from vehicle and α-tocopherol injected rats as an internal standard (see methods). α-CEHC and trolox (internal standard) in (A) a representative mitochondrial sample from a vehicle-injected rat, (B) a representative mitochondrial sample from an α-tocopherol-injected rat, (C) a representative peroxisome sample from a vehicle-injected rat and (D) a representative peroxisome sample from an α-tocopherol-injected rat. α-CEHC and trolox were determined by a single-quadrupole LC/MS using an electrospray ionization source, as described in the methods. α-CEHC (mass-to charge ratio (m/z) 277) retention time = 15.42 - 15.46 (solid line). Trolox (m/z 249) retention time = 14.4 - 14.45 (dashed line).
Fig. 9
Proposed pathway of α-tocopherol metabolism in which both peroxisomes and mitochondria play a role
Similar articles
- α-Tocopherol injections in rats up-regulate hepatic ABC transporters, but not cytochrome P450 enzymes.
Traber MG, Labut EM, Leonard SW, Lebold KM. Traber MG, et al. Free Radic Biol Med. 2011 Dec 1;51(11):2031-40. doi: 10.1016/j.freeradbiomed.2011.08.033. Epub 2011 Sep 3. Free Radic Biol Med. 2011. PMID: 21945367 Free PMC article. - Alpha-tocopherol regulation of hepatic cytochrome P450s and ABC transporters in rats.
Mustacich DJ, Leonard SW, Devereaux MW, Sokol RJ, Traber MG. Mustacich DJ, et al. Free Radic Biol Med. 2006 Oct 1;41(7):1069-78. doi: 10.1016/j.freeradbiomed.2006.06.022. Epub 2006 Jul 4. Free Radic Biol Med. 2006. PMID: 16962932 - Vitamin E decreases extra-hepatic menaquinone-4 concentrations in rats fed menadione or phylloquinone.
Farley SM, Leonard SW, Labut EM, Raines HF, Card DJ, Harrington DJ, Mustacich DJ, Traber MG. Farley SM, et al. Mol Nutr Food Res. 2012 Jun;56(6):912-22. doi: 10.1002/mnfr.201100751. Mol Nutr Food Res. 2012. PMID: 22707266 - Discovery, characterization, and significance of the cytochrome P450 omega-hydroxylase pathway of vitamin E catabolism.
Parker RS, Sontag TJ, Swanson JE, McCormick CC. Parker RS, et al. Ann N Y Acad Sci. 2004 Dec;1031:13-21. doi: 10.1196/annals.1331.002. Ann N Y Acad Sci. 2004. PMID: 15753130 Review. - gamma-tocopherol, the major form of vitamin E in the US diet, deserves more attention.
Jiang Q, Christen S, Shigenaga MK, Ames BN. Jiang Q, et al. Am J Clin Nutr. 2001 Dec;74(6):714-22. doi: 10.1093/ajcn/74.6.714. Am J Clin Nutr. 2001. PMID: 11722951 Review.
Cited by
- α-Tocopherol transfer protein does not regulate the cellular uptake and intracellular distribution of α- and γ-tocopherols and -tocotrienols in cultured liver cells.
Irías-Mata A, Sus N, Flory S, Stock D, Woerner D, Podszun M, Frank J. Irías-Mata A, et al. Redox Biol. 2018 Oct;19:28-36. doi: 10.1016/j.redox.2018.07.027. Epub 2018 Aug 5. Redox Biol. 2018. PMID: 30098456 Free PMC article. - Long-Chain Metabolites of Vitamin E: Metabolic Activation as a General Concept for Lipid-Soluble Vitamins?
Schubert M, Kluge S, Schmölz L, Wallert M, Galli F, Birringer M, Lorkowski S. Schubert M, et al. Antioxidants (Basel). 2018 Jan 12;7(1):10. doi: 10.3390/antiox7010010. Antioxidants (Basel). 2018. PMID: 29329238 Free PMC article. Review. - Gamma-tocopherol, a major form of vitamin E in diets: Insights into antioxidant and anti-inflammatory effects, mechanisms, and roles in disease management.
Jiang Q, Im S, Wagner JG, Hernandez ML, Peden DB. Jiang Q, et al. Free Radic Biol Med. 2022 Jan;178:347-359. doi: 10.1016/j.freeradbiomed.2021.12.012. Epub 2021 Dec 9. Free Radic Biol Med. 2022. PMID: 34896589 Free PMC article. - Omega-3 and alpha-tocopherol provide more protection against contaminants in novel feeds for Atlantic salmon (Salmo salar L.) than omega-6 and gamma tocopherol.
Søfteland L, Berntssen MHG, Kirwan JA, Størseth TR, Viant MR, Torstensen BE, Waagbø R, Olsvik PA. Søfteland L, et al. Toxicol Rep. 2016 Jan 14;3:211-224. doi: 10.1016/j.toxrep.2016.01.008. eCollection 2016. Toxicol Rep. 2016. PMID: 28959541 Free PMC article. - Natural forms of vitamin E: metabolism, antioxidant, and anti-inflammatory activities and their role in disease prevention and therapy.
Jiang Q. Jiang Q. Free Radic Biol Med. 2014 Jul;72:76-90. doi: 10.1016/j.freeradbiomed.2014.03.035. Epub 2014 Apr 3. Free Radic Biol Med. 2014. PMID: 24704972 Free PMC article. Review.
References
- Ford ES, Ajani UA, Mokdad AH. Brief communication: The prevalence of high intake of vitamin E from the use of supplements among U.S. adults. Ann Intern Med. 2005;143:116–120. - PubMed
- Bjelakovic G, Nikolova D, Simonetti RG, Gluud C. Antioxidant supplements for prevention of gastrointestinal cancers: a systematic review and meta-analysis. Lancet. 2004;364:1219–1228. - PubMed
- Miller ER, 3rd, Paston-Barriuso R, Dalal D, Riemersma RA, Appel LJ, Guallar E. Meta-analysis: high-dosage vitamin E supplementation may increase all-cause mortality. Ann Intern Med. 2005;142:37–46. - PubMed
- Mustacich DJ, Leonard SW, Devereaux MW, Sokol RJ, Traber MG. α-Tocopherol regulation of hepatic cytochrome P450s and ABC transporters in rats. Free Radic Biol Med. 2006;41:1069–1078. - PubMed
- Stahl W, Graf P, Brigelius-Flohe R, Wechter W, Sies H. Quantification of the alpha- and gamma-tocopherol metabolites 2,5,7,8-tetramethyl-2-(2′-carboxyethyl)-6-hydroxychroman and 2,7,8-trimethyl-2-(2′-carboxyethyl)-6-hydroxychroman in human serum. Anal Biochem. 1999;275:254–259. - PubMed
Publication types
MeSH terms
Substances
LinkOut - more resources
Full Text Sources


