Cytoplasmic relaxation of active Eph controls ephrin shedding by ADAM10 - PubMed (original) (raw)
Cytoplasmic relaxation of active Eph controls ephrin shedding by ADAM10
Peter W Janes et al. PLoS Biol. 2009 Oct.
Abstract
Release of cell surface-bound ligands by A-Disintegrin-And-Metalloprotease (ADAM) transmembrane metalloproteases is essential for signalling by cytokine, cell adhesion, and tyrosine kinase receptors. For Eph receptor ligands, it provides the switch between cell-cell adhesion and repulsion. Ligand shedding is tightly controlled by intrinsic tyrosine kinase activity, which for Eph receptors relies on the release of an inhibitory interaction of the cytoplasmic juxtamembrane segment with the kinase domain. However, a mechanism linking kinase and sheddase activities had remained elusive. We demonstrate that it is a membrane-proximal localisation of the latent kinase domain that prevents ephrin ligand shedding in trans. Fluorescence lifetime imaging microscopy and electron tomography reveal that activation extends the Eph receptor tyrosine kinase intracellular domain away from the cell membrane into a conformation that facilitates productive association with ADAM10. Accordingly, EphA3 mutants with constitutively-released kinase domains efficiently support shedding, even when their kinase is disabled. Our data suggest that this phosphorylation-activated conformational switch of EphA3 directly controls ADAM-mediated shedding.
Conflict of interest statement
The authors have declared that no competing interests exist.
Figures
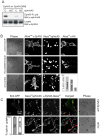
Figure 1. Ephrin shedding is inhibited by lack of kinase activity but not by cytoplasmic truncation of EphA3 or ADAM10.
(A) EphA3 kinase activity is required for effective ephrin cleavage. HEK293T cells expressing EphA3 Wt or EphA3[KM] (with a mutated ATP-binding site, K653→M) were treated with clustered (C) or non-clustered (NC) ephrin-A5-Fc. Cleaved ephrin-A5 was extracted by EphA3-Fc pulldown and recovered ephrin-A5 and total cell extracts were immunoblotted as indicated. Low level ephrin-A5 shedding observed with ephrin-A5-Fc -treated EphA3[KM] cells is likely due to endogenous EphA3 present in parental HEK293T cells . (B) Truncation of the ADAM10 ICD (ΔICD) does not affect ephrin-A5 cleavage and internalisation. Cells expressing endogenous ADAM10 and EphA3-GFP were transfected with HA-ADAM10[ΔMP] (top), HA-ADAM10[ΔICD] (middle), or control vector (bottom) and exposed to Alexa594ephrin-A5-Fc coated beads. EphA3-GFP, internalised ephrin-A5, and HA-ADAM staining (Alexa647) were imaged by confocal microscopy. The relative ephrin-A5 labelling of receptor-expressing cells (mean+/−SEM), with or without ADAM10[ΔICD] or ADAM10[ΔMP] co-expression, is shown. (C) Cleavage of ephrin-A5 from conjugated beads in the presence of EphA3[Δcyto]-expressing cells. HEK293T cells expressing Wt EphA3-GFP or EphA3[Δcyto] as indicated were incubated with Alexa594ephrin-A5-Fc-conjugated beads before staining with Alexa647anti-EphA3 antibody. Confocal microscope images show representative cells stained with cleaved ephrin-A5. Pseudocolours in the merged images illustrate: green, EphA3-GFP; red, Alexa594ephrin-A5; blue, Alexa647anti-EphA3 antibody. The graph shows the relative ephrin-labelling of cells (mean+/−SEM), with cells containing internalised ephrin shown in dark grey and cell-surface ephrin in light gray.
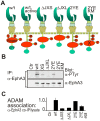
Figure 2. Mutation of the JM domain affects EphA3 phosphorylation and ADAM10 association.
(A) Schematic structure of Wt EphA3-GFP and derived ICD mutants (see text for details) that were used in these studies. Y, tyrosine; P, phospho-tyrosine; E, glutamate (pseudophosphorylation) ; X, inactive kinase. (B) Tyrosine phosphorylation of Wt and mutant EphA3. EphA3 immunoprecipitates from lysates of ephrin-A5-Fc-stimulated cells were immunoblotted with anti-phosphotyrosine and anti-EphA3 antibodies as indicated. (C) ADAM10 association with Wt and mutant EphA3. ADAM10 immunoprecipitates and total cell lysates from Wt or mutant (as indicated) EphA3-transfected cells (ephrin-A5-treated) were analysed for EphA3 and ADAM10 by immunoblot (see Figure S4B). The average ratio (+/−SD) of EphA3 in precipitates relative to lysates (n = 2 experiments) is plotted, with EphA3[2YE] as internal reference.
Figure 3. EphA3 JM and kinase domain mutations affect ephrin-A5 shedding and internalisation, respectively.
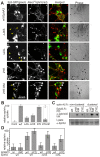
Figure 4. CaM-binding to chimeric EphA3/L-selectin regulates ephrin cleavage.
(A) Confocal analysis of ephrin release: EphA3/L-selectin transfected HEK293T cells were pre-treated with CaM inhibitors trifluoperazine dimaleate (TFP, 15 µM), Calm (2 µM), W7 (N-6-Aminohexyl0-5-chloro-1-naphthalenesulfonamide, 50 or 100 µM), or vehicle control before incubation with Alexa488ephrin-A5-Fc beads. Cell surface EphA3/L-selectin (Alexa647 α-EphA3 antibody, red) and Alexa488ephrin-A5 (green) were imaged in fixed cells by confocal microscopy. Insets show cells treated with 100 µM W7. (B) The ratio of ephrin-A5-associated and EphA3/L-selectin associated fluorescence was estimated from images of control or inhibitor-treated cell cultures taken under identical conditions. Mean values are illustrated (_n_>4), with error bars indicating 95% confidence intervals determined by the ANOVA test for multiple comparisons. (C) Biochemical analysis of ephrin release: EphA3/L-selectin transfected HEK293T cells were pre-treated with CaM inhibitors (as in (A), using 50 µM W7) or vehicle control and incubated with ephrin-A5-Fc coated beads. In parallel, EphA3[2YE-KM]-expressing cells were incubated with ephrin-A5-Fc coated beads only. Ephrin-A5 recovered by EphA3-Fc pulldown was immunoblotted with α-ephrin-A5 antibodies. Total lysates were probed for EphA3/L-selectin (Eph-Sel) expression with α-EphA3 antibodies (bottom). * indicates non-relevant proteins recognised by α-EphA3 antibodies in total lysates.
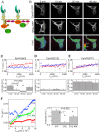
Figure 5. FLIM analysis shows EphA3 activation accompanies extension of the cytoplasmic domain.
(A) Schematic of the FRET-assay; FRET (yellow arrow) reflects the proximity between the GFP on the EphA3 C-terminus and tkRasRFP on the inner plasma membrane (Kin, kinase domain). (B) Confocal FLIM time-series of EphA3-GFP in tkRasRFP co-transfected COS7 cells at indicated times (min) after ephrin-A5 stimulation. Upper row: EphA3-GFP fluorescence intensity images. Middle row: tkRasRFP fluorescence intensity images. Lower row: fluorescence lifetime images of EphA3-GFP; the colour bar inset indicates the fluorescence lifetime range in ns. (C) Upper panel: 2D-histograms of fluorescence rate τ−1 versus tkRasRFP acceptor intensities for 0 min (red) and 20 min (blue) of the EphA3-GFP confocal FLIM series. Linear fitting of the time series 2D-histograms are indicated by solid lines. Lower panel: acceptor normalized energy transfer rate, kT/acceptor, for selected time points after EphA3 stimulation as derived from the slope of the fits to the 2D-histograms. (D) Upper panel: 2D-histograms of τ−1 tkRasRFP acceptor intensities for 0 min (red) and 20 min (blue) of a 2YE-EphA3-GFP confocal FLIM time series after ephrin-A5 stimulation (see also Figure S6F). Lower panel: acceptor normalized energy transfer rate, kT/acceptor, of the time series as in (C). (E) Upper panel: 2D-histograms of τ−1 tkRasRFP acceptor intensities for 0 min (red) and 20 min (blue) of a 3YF-EphA3-GFP confocal FLIM time series after ephrin-A5 stimulation. Lower panel: acceptor normalized energy transfer rate, kT/acceptor, of the time series as in (C). (F) Left panel: 2D-histograms of fluorescence rate, τ−1, versus acceptor intensities for EphA3 [2YE], [3YF], and [2YE-KM] obtained from at least 16 fluorescence lifetime/acceptor intensity images obtained with wide-field frequency-domain FLIM. Right panel: linear fitting of these data showed a significant difference between the slopes (kT/acceptor) for EphA3-GFP-[2YE] and EphA3-GFP-[3YF].
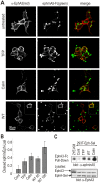
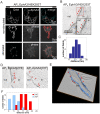
Figure 6. EM of Qdot labelled EphA3 reveals the molecular span to the plasma membrane.
(A) Confocal microscopic images of APN EphA3/HEK293T cells, biotinylated with recombinant biotin ligase (BirA) and labelled with SA-Qdots605. Cells were left non-stimulated (top and middle panel) or ephrin stimulated (bottom panel). To show the specificity of binding of the SA-Qdots to EphA3, samples were co-stained with an EphA3-specific monoclonal antibody. Qdot staining is shown in red in the merged images. (B) EM image of biotinylated APN EphA3/HEK293T cells labelled with SA-Qdots605. Arrowheads mark EphA3-tethered Qdots on the outer cell membrane; insert: enlarged section of the (red) boxed area. (C) Histogram depicting distances between Qdots bound to the NH2terminus of EphA3 and the plasma membrane. Distances were measured from EM images of biotinylated APN EphA3/HEK293T cells that were incubated with SA-Qdots605 as shown in (B). (D) SA-Qdot605 micro-injected cells expressing APC-EphA3[2YE] and [3YF] as indicated. Each image represents a 10 nm thick computational slice after 3D reconstruction from EM tomography. Arrow heads indicate Qdots. (E) 3D reconstruction of an entire tilt series of images of a cell expressing APC-EphA3[3YF] (plasma membrane, blue; Qdots, yellow; and marked by red arrowheads). A corresponding movie is included as supporting information (Video S1). (F) Histogram showing the cytoplasmic span of inactive versus active EphA3. Membrane-Qdot distances were measured in cells expressing biotinylated APC-EphA3[3YF] (blue) or APC-EphA3[2YE] (red) that had been labelled with micro-injected SA-Qdots605. Qdot/plasma membrane distances are plotted at 3 nm intervals (3YF, n = 30; 2YE, n = 37). Kolmogorov-Smirnov (KS) and t statistical tests suggested a highly significant (p<0.001) difference between the two datasets.
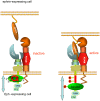
Figure 7. Model for activation-mediated release of the membrane-proximal Eph kinase domain promoting productive ADAM10 alignment and ephrin shedding.
The (helical) JM segment (red) of the unligated Eph receptor is tethered to the small (N-terminal) lobe of the kinase , keeping the kinase domain (green) in an inactive, membrane-proximal conformation. Ephrin binding, Eph clustering (for simplicity only one Eph/ephrin pair is illustrated instead of a cluster), activation, and auto-phosphorylation result in release of the tyrosine-phosphorylated JM segment into a dynamic disordered protein fold that allows extension of the kinase domain and the Eph C-terminus away from the membrane. ADAM10, constitutively associated with the receptor, can then bind a new site formed by the Eph/ephrin complex via the ADAM10 substrate recognition motif, which in turn mediates the correct orientation of the protease domain for ephrin cleavage . The stoichiometry of the ADAM10/Eph/ephrin complex remains to be elaborated. Importantly, this productive alignment of ADAM10 and Eph RTK relies on a RTK configuration where its kinase domain—exerting steric hindrance for ADAM10 association—is removed from the plasma membrane.
Similar articles
- The role of proteases in regulating Eph/ephrin signaling.
Atapattu L, Lackmann M, Janes PW. Atapattu L, et al. Cell Adh Migr. 2014;8(4):294-307. doi: 10.4161/19336918.2014.970026. Cell Adh Migr. 2014. PMID: 25482632 Free PMC article. Review. - Adam meets Eph: an ADAM substrate recognition module acts as a molecular switch for ephrin cleavage in trans.
Janes PW, Saha N, Barton WA, Kolev MV, Wimmer-Kleikamp SH, Nievergall E, Blobel CP, Himanen JP, Lackmann M, Nikolov DB. Janes PW, et al. Cell. 2005 Oct 21;123(2):291-304. doi: 10.1016/j.cell.2005.08.014. Cell. 2005. PMID: 16239146 - ADAM and Eph: how Ephrin-signaling cells become detached.
Mancia F, Shapiro L. Mancia F, et al. Cell. 2005 Oct 21;123(2):185-7. doi: 10.1016/j.cell.2005.10.004. Cell. 2005. PMID: 16239135 - Attenuation of eph receptor kinase activation in cancer cells by coexpressed ephrin ligands.
Falivelli G, Lisabeth EM, Rubio de la Torre E, Perez-Tenorio G, Tosato G, Salvucci O, Pasquale EB. Falivelli G, et al. PLoS One. 2013 Nov 29;8(11):e81445. doi: 10.1371/journal.pone.0081445. eCollection 2013. PLoS One. 2013. PMID: 24348920 Free PMC article. - Eph receptor and ephrin function in breast, gut, and skin epithelia.
Perez White BE, Getsios S. Perez White BE, et al. Cell Adh Migr. 2014;8(4):327-38. doi: 10.4161/19336918.2014.970012. Cell Adh Migr. 2014. PMID: 25482622 Free PMC article. Review.
Cited by
- Eph- and ephrin-dependent mechanisms in tumor and stem cell dynamics.
Gucciardo E, Sugiyama N, Lehti K. Gucciardo E, et al. Cell Mol Life Sci. 2014 Oct;71(19):3685-710. doi: 10.1007/s00018-014-1633-0. Epub 2014 May 4. Cell Mol Life Sci. 2014. PMID: 24794629 Free PMC article. Review. - EGCG functions through estrogen receptor-mediated activation of ADAM10 in the promotion of non-amyloidogenic processing of APP.
Fernandez JW, Rezai-Zadeh K, Obregon D, Tan J. Fernandez JW, et al. FEBS Lett. 2010 Oct 8;584(19):4259-67. doi: 10.1016/j.febslet.2010.09.022. Epub 2010 Sep 17. FEBS Lett. 2010. PMID: 20849853 Free PMC article. - EphrinA/EphA-induced ectodomain shedding of neural cell adhesion molecule regulates growth cone repulsion through ADAM10 metalloprotease.
Brennaman LH, Moss ML, Maness PF. Brennaman LH, et al. J Neurochem. 2014 Jan;128(2):267-79. doi: 10.1111/jnc.12468. Epub 2013 Oct 21. J Neurochem. 2014. PMID: 24117969 Free PMC article. - The role of proteases in regulating Eph/ephrin signaling.
Atapattu L, Lackmann M, Janes PW. Atapattu L, et al. Cell Adh Migr. 2014;8(4):294-307. doi: 10.4161/19336918.2014.970026. Cell Adh Migr. 2014. PMID: 25482632 Free PMC article. Review. - Eps15R and clathrin regulate EphB2-mediated cell repulsion.
Evergren E, Cobbe N, McMahon HT. Evergren E, et al. Traffic. 2018 Jan;19(1):44-57. doi: 10.1111/tra.12531. Epub 2017 Nov 6. Traffic. 2018. PMID: 28972287 Free PMC article.
References
- Kheradmand F, Werb Z. Shedding light on sheddases: role in growth and development. Bioessays. 2002;24:8–12. - PubMed
- Hartmann D, de Strooper B, Serneels L, Craessaerts K, Herreman A, et al. The disintegrin/metalloprotease ADAM 10 is essential for Notch signalling but not for alpha-secretase activity in fibroblasts. Hum Mol Genet. 2002;11:2615–2624. - PubMed
- Peschon J. J, Slack J. L, Reddy P, Stocking K. L, Sunnarborg S. W, et al. An essential role for ectodomain shedding in mammalian development. Science. 1998;282:1281–1284. - PubMed
- Seals D. F, Courtneidge S. A. The ADAMs family of metalloproteases: multidomain proteins with multiple functions. Genes Dev. 2003;17:7–30. - PubMed
- Blobel C. P. ADAMs: key components in EGFR signalling and development. Nat Rev Mol Cell Biol. 2005;6:32–43. - PubMed
Publication types
MeSH terms
Substances
LinkOut - more resources
Full Text Sources
Molecular Biology Databases
Miscellaneous
