Intravital imaging reveals transient changes in pigment production and Brn2 expression during metastatic melanoma dissemination - PubMed (original) (raw)
Intravital imaging reveals transient changes in pigment production and Brn2 expression during metastatic melanoma dissemination
Sophie Pinner et al. Cancer Res. 2009.
Abstract
How melanoma acquire a metastatic phenotype is a key issue. One possible mechanism is that metastasis is driven by microenvironment-induced switching between noninvasive and invasive states. However, whether switching is a reversible or hierarchical process is not known and is difficult to assess by comparison of primary and metastatic tumors. We address this issue in a model of melanoma metastasis using a novel intravital imaging method for melanosomes combined with a reporter construct in which the Brn-2 promoter drives green fluorescent protein (GFP) expression. A subpopulation of cells containing little or no pigment and high levels of Brn2::GFP expression are motile in the primary tumor and enter the vasculature. Significantly, the less differentiated state of motile and intravasated cells is not maintained at secondary sites, implying switching between states as melanoma cells metastasize. We show that melanoma cells can switch in both directions between high- and low-pigment states. However, switching from Brn2::GFP high to low was greatly favored over the reverse direction. Microarray analysis of high- and low-pigment populations revealed that transforming growth factor (TGF)beta2 was up-regulated in the poorly pigmented cells. Furthermore, TGFbeta signaling induced hypopigmentation and increased cell motility. Thus, a subset of less differentiated cells exits the primary tumor but subsequently give rise to metastases that include a range of more differentiated and pigment-producing cells. These data show reversible phenotype switching during melanoma metastasis.
Figures
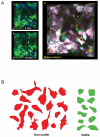
Figure 1. In vivo imaging of melanoma motility
A) Panels (i)&(ii) show 3D reconstructions of a B16-GFP tumour at two times 10 minutes apart. GFP is shown in green and reflectance imaging is shown in blue, arrows highlight motile cells. Panel (iii) shows a merged image of GFP signal from the same tumour volume as in panels (i)&(ii) at three different times with 0min shown in red 5min shown in blue and 10min shown in green. White areas indicate static cells. Scale bar is 20μm. B) Representative tracings of the 3D morphology of non-motile (red) and motile (green) cells.
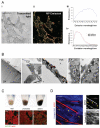
Figure 2. Pigment containing melanosomes can be identified by visible light emission following near infra-red illumination
A) B16F2 cells stimulated with α-MSH were imaged by transmitted light (i) and laser scanning microscopy following illumination at 800nm (ii) merged image of emission at 410-450nm (cyan), 500-550nm (green) and 565-615nm (red). Scale bar is 25μm. Emission and excitation spectra of near infrared stimulated visible emission are shown in panels (iii) and (iv), respectively. B) Transmitted light and NIRVE images (dark red) of B16 cells are shown overlaid (left-hand panel). A cell with a long process and high NIRVE signal is visible surrounded by cells with low NIRVE signal. Transmission electron microscopy images of the same area are shown. Mid-left panel shows a low magnification image of the NIRVE positive cell and surrounding cells. Inset panels 1-3 show high magnification images of the areas indicated on the low magnification image. White, orange and red asterisks are placed adjacent to stage 2, 3, and 4 melanosomes, respectively. C) Upper panel shows changes in pigment followingα-MSH or H89 treatment. Lower panels show NIRVE signal in green following α-MSH or H89 treatment. F-actin is in red. Scale bar is 50μm. D) Ear skin of mouse showing collagen (blue: collected between 420-490nm* following illumination at 800nm) and NIRVE signal (red: collected between 575-630nm following illumination at 800nm) are shown. See also Supplementary Movie2. Arrows indicate pigment producing melanocytes. * some NIRVE signal is also collected.
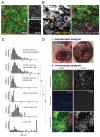
Figure 3. Monitoring pigment expression during melanoma dissemination
A) High resolution imaging of subcutaneous B16F2-GFP-CAAX tumour. GFP (green) and NIRVE signal (red - collected between 410-530nm following illumination at 790nm) are shown. Scale bar is 25μm. B) Left-hand panel shows motion analysis of intravital imaging of B16F2-GFP melanoma - white areas are non-motile, distinct areas of colour indicate motile cells (also highlighted with arrows). Right-hand panel shows NIRVE signal from the same region with inset panel showing the positions of motile cells relative to the NIRVE signal (see also Supplementary Movies 3&4). Scale bar is 25μm. C) Histograms showing the quantification of pigment content in both motile and non-motile tumour cells in the primary tumour, cells that had entered the vasculature, lymph node metastases and lung metastases. Values are normalised to 1 for the primary tumour. * indicates p<0.01 Kruskil-WallisANOVA test. D) i) Macroscopic image showing the highly pigmented nature of the primary tumour, a lymph node metastasis and lung metastases. ii) Images of B16F2-GFP-CAAX tumour cells in primary tumour, blood, and lymph node. Merge shows GFP in green, NIRVE signal in red, and collagen in blue - scale bar is 100microns.
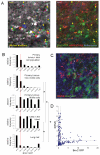
Figure 4. Brn-2 promoter activity during melanoma dissemination
A) Left-hand panel shows motion analysis of intravital imaging of B16F2 Brn-2:GFP/mRFP-CAAX melanoma - white areas are non-motile, distinct areas of colour indicate motile cells (highlighted with arrows - scale bar is 20μm). Right-hand panel shows GFP signal from the Brn-2 promoter (green) mRFP-CAAX (red) and reflectance (blue) in same region (motile cells are highlighted with arrows - see also Supplementary Movie5). B) Histograms showing the quantification of pigment content in both motile and non-motile tumour cells in the primary tumour, cells that had entered the vasculature, lymph node metastases and lung metastases. Values are normalised to 1 for the primary tumour. * indicates p<0.01 Kruskil-WallisANOVA test. C) Intravital image of B16F2 Brn2::GFP/mRFP-CAAX tumour. GFP is shown in green, mRFP-CAAX in blue and NIRVE signal in red. D) Scatter plot showing the relationship between NIRVE signal and GFP expression from the Brn-2 promoter. Each cross represents the values in individual cells imaged in vivo.
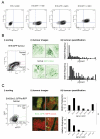
Figure 5. Flow cytometry analysis of pigment content
A) FACS profile of B16F2 cells with or without stable GFP expression (two left-hand panels). Effect of H89 or α-MSH on violet laser stimulated 450nm emission is shown by contour plots. B) (i) B16F2-GFP CAAX tumour cells isolated from xenograft tumours in nude mice. Contour plots show GFP (530-30nm) against Violet (450-40nm) emission. Blue line shows gate used to sort GFP expressing cells and magenta lines show the gates used to sort the top and bottom 10% pigmented cells. (ii) Pigment high and low populations were re-introduced into the tail vein of mice and the resulting lung colonies were imaged. Representative images are shown with NIRVE signal in black and GFP in green. (iii) Quantification of pigment levels assessed on a cell by cell basis in colonies generated from pigment high and low populations. Relative frequency of pigment levels is shown (data from 12 mice in three independent experiments). C) (i) B16F2 Brn2::GFP/mRFP-CAAX tumour cells isolated from xenograft tumours in nude mice. Contour plots show Red (620-40nm) against GFP (530-30nm) emission. Blue line shows gate used to sort mRFP expressing cells and green lines show the gates used to sort the top and bottom 10% Brn2::GFP cells. (ii) Brn2::GFP high and low populations were re-introduced into the tail vein of mice and the resulting lung colonies were imaged. Two representative images are shown with mRFP-CAAX signal in red and Brn2::GFP in green. * highlights three cells that have converted back to high levels of Brn2::GFP expression. (iii) Quantification of Brn2::GFP levels assessed on a cell by cell basis in colonies generated from Brn2::GFP high and low populations. Relative frequency of Brn2::GFP levels is shown (data from 10 mice in three independent experiments). *indicates p<0.01 Mann-Whitney test.
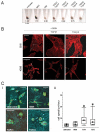
Figure 6. TGFβ induces hypopigmentation, inhibits dendrite formation and increases cell motility
A) Cell pellets of B16F2 cells treated with H89 αMSH or TGFβ for 48 hours are shown. Numbers indicate digital analysis of pellet darkness. B) NIRVE (white - collected between 410-530nm following illumination at 790nm) and F-actin (red) merged images of B16F2 and 4599 mouse melanoma cells treated with αMSH for 24hrs and, where indicated TGFβ1 or TGFβ2 for 24 hours prior to α-MSH treatment are shown. Scale bar is 50μm. C) i) B16F2 cells plated on deformable collagen/matrigel matrix (cyan) and stained for F-actin (green) and DNA (red). Scale bar is 50μm. ii) Box plots of cell speeds in microns/hour taken from phase contrast movies of B16F2 cells plated on deformable collagen/matrigel matrix over 16 hour period.*indicates p<0.01 Mann-Whitney test.
Similar articles
- Bi-allelic Loss of CDKN2A Initiates Melanoma Invasion via BRN2 Activation.
Zeng H, Jorapur A, Shain AH, Lang UE, Torres R, Zhang Y, McNeal AS, Botton T, Lin J, Donne M, Bastian IN, Yu R, North JP, Pincus L, Ruben BS, Joseph NM, Yeh I, Bastian BC, Judson RL. Zeng H, et al. Cancer Cell. 2018 Jul 9;34(1):56-68.e9. doi: 10.1016/j.ccell.2018.05.014. Cancer Cell. 2018. PMID: 29990501 Free PMC article. - BRN2, a POUerful driver of melanoma phenotype switching and metastasis.
Fane ME, Chhabra Y, Smith AG, Sturm RA. Fane ME, et al. Pigment Cell Melanoma Res. 2019 Jan;32(1):9-24. doi: 10.1111/pcmr.12710. Epub 2018 Jun 5. Pigment Cell Melanoma Res. 2019. PMID: 29781575 Review. - Epithelial-mesenchymal-transition-like and TGFβ pathways associated with autochthonous inflammatory melanoma development in mice.
Wehbe M, Soudja SM, Mas A, Chasson L, Guinamard R, de Tenbossche CP, Verdeil G, Van den Eynde B, Schmitt-Verhulst AM. Wehbe M, et al. PLoS One. 2012;7(11):e49419. doi: 10.1371/journal.pone.0049419. Epub 2012 Nov 16. PLoS One. 2012. PMID: 23173060 Free PMC article. - BRN2 is a non-canonical melanoma tumor-suppressor.
Hamm M, Sohier P, Petit V, Raymond JH, Delmas V, Le Coz M, Gesbert F, Kenny C, Aktary Z, Pouteaux M, Rambow F, Sarasin A, Charoenchon N, Bellacosa A, Sanchez-Del-Campo L, Mosteo L, Lauss M, Meijer D, Steingrimsson E, Jönsson GB, Cornell RA, Davidson I, Goding CR, Larue L. Hamm M, et al. Nat Commun. 2021 Jun 17;12(1):3707. doi: 10.1038/s41467-021-23973-5. Nat Commun. 2021. PMID: 34140478 Free PMC article. - POU transcription factors in melanocytes and melanoma.
Besch R, Berking C. Besch R, et al. Eur J Cell Biol. 2014 Jan-Feb;93(1-2):55-60. doi: 10.1016/j.ejcb.2013.10.001. Epub 2013 Oct 26. Eur J Cell Biol. 2014. PMID: 24315688 Review.
Cited by
- Mechanisms contributing to differential regulation of PAX3 downstream target genes in normal human epidermal melanocytes versus melanoma cells.
Bartlett D, Boyle GM, Ziman M, Medic S. Bartlett D, et al. PLoS One. 2015 Apr 16;10(4):e0124154. doi: 10.1371/journal.pone.0124154. eCollection 2015. PLoS One. 2015. PMID: 25880082 Free PMC article. - Identification of the hypoxia-inducible factor 2α nuclear interactome in melanoma cells reveals master proteins involved in melanoma development.
Steunou AL, Ducoux-Petit M, Lazar I, Monsarrat B, Erard M, Muller C, Clottes E, Burlet-Schiltz O, Nieto L. Steunou AL, et al. Mol Cell Proteomics. 2013 Mar;12(3):736-48. doi: 10.1074/mcp.M112.020727. Epub 2012 Dec 28. Mol Cell Proteomics. 2013. PMID: 23275444 Free PMC article. - Low Doses of Celecoxib Might Promote Phenotype Switching in Cutaneous Melanoma Treated with Dabrafenib-Preliminary Study.
Tudor DV, Florea A, Cenariu M, Olteanu DE, Farcaș M, Hopârtean A, Clichici SV, Filip GA. Tudor DV, et al. J Clin Med. 2022 Aug 4;11(15):4560. doi: 10.3390/jcm11154560. J Clin Med. 2022. PMID: 35956175 Free PMC article. - Genetic and Genomic Pathways of Melanoma Development, Invasion and Metastasis.
Motwani J, Eccles MR. Motwani J, et al. Genes (Basel). 2021 Sep 28;12(10):1543. doi: 10.3390/genes12101543. Genes (Basel). 2021. PMID: 34680938 Free PMC article. Review. - BORIS/CTCFL promotes a switch from a proliferative towards an invasive phenotype in melanoma cells.
Janssen SM, Moscona R, Elchebly M, Papadakis AI, Redpath M, Wang H, Rubin E, van Kempen LC, Spatz A. Janssen SM, et al. Cell Death Discov. 2020 Jan 2;6:1. doi: 10.1038/s41420-019-0235-x. eCollection 2020. Cell Death Discov. 2020. PMID: 32123577 Free PMC article.
References
- Gaggioli C, Sahai E. Melanoma invasion - current knowledge and future directions. Pigment Cell Res. 2007;20(3):161–72. - PubMed
- Bronner-Fraser M. Neural crest cell migration in the developing embryo. Trends Cell Biol. 1993;3(11):392–7. - PubMed
- Yamaguchi Y, Brenner M, Hearing VJ. The regulation of skin pigmentation. J Biol Chem. 2007;282(38):27557–61. - PubMed
- Goodall J, Carreira S, Denat L, et al. Brn-2 represses microphthalmia-associated transcription factor expression and marks a distinct subpopulation of microphthalmia-associated transcription factor-negative melanoma cells. Cancer Res. 2008;68(19):7788–94. - PubMed
- Gaggioli C, Busca R, Abbe P, Ortonne JP, Ballotti R. Microphthalmia-associated transcription factor (MITF) is required but is not sufficient to induce the expression of melanogenic genes. Pigment Cell Res. 2003;16(4):374–82. - PubMed
Publication types
MeSH terms
Substances
LinkOut - more resources
Full Text Sources
Medical
