Human DNA methylomes at base resolution show widespread epigenomic differences - PubMed (original) (raw)
. 2009 Nov 19;462(7271):315-22.
doi: 10.1038/nature08514. Epub 2009 Oct 14.
Mattia Pelizzola, Robert H Dowen, R David Hawkins, Gary Hon, Julian Tonti-Filippini, Joseph R Nery, Leonard Lee, Zhen Ye, Que-Minh Ngo, Lee Edsall, Jessica Antosiewicz-Bourget, Ron Stewart, Victor Ruotti, A Harvey Millar, James A Thomson, Bing Ren, Joseph R Ecker
Affiliations
- PMID: 19829295
- PMCID: PMC2857523
- DOI: 10.1038/nature08514
Human DNA methylomes at base resolution show widespread epigenomic differences
Ryan Lister et al. Nature. 2009.
Abstract
DNA cytosine methylation is a central epigenetic modification that has essential roles in cellular processes including genome regulation, development and disease. Here we present the first genome-wide, single-base-resolution maps of methylated cytosines in a mammalian genome, from both human embryonic stem cells and fetal fibroblasts, along with comparative analysis of messenger RNA and small RNA components of the transcriptome, several histone modifications, and sites of DNA-protein interaction for several key regulatory factors. Widespread differences were identified in the composition and patterning of cytosine methylation between the two genomes. Nearly one-quarter of all methylation identified in embryonic stem cells was in a non-CG context, suggesting that embryonic stem cells may use different methylation mechanisms to affect gene regulation. Methylation in non-CG contexts showed enrichment in gene bodies and depletion in protein binding sites and enhancers. Non-CG methylation disappeared upon induced differentiation of the embryonic stem cells, and was restored in induced pluripotent stem cells. We identified hundreds of differentially methylated regions proximal to genes involved in pluripotency and differentiation, and widespread reduced methylation levels in fibroblasts associated with lower transcriptional activity. These reference epigenomes provide a foundation for future studies exploring this key epigenetic modification in human disease and development.
Figures
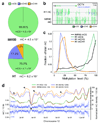
Figure 1. Global trends of Human DNA methylomes
a, The percent of methylcytosines identified for H1 and IMR90 cells in each sequence context. b, AnnoJ browser representation of OCT4. c, Distribution of the methylation level in each sequence context. The y-axis indicates the fraction of all methylcytosines that display each methylation level (x-axis), where methylation level is the mC/C ratio at each reference cytosine (at least 10 reads required) d, Blue dots indicate methylcytosine density in H1 cells in 10 kb windows throughout chromosome 12 (black rectangle, centromere). Smoothed lines represent the methylcytosine density in each context in H1 and IMR90. Black triangles indicate various regions of contrasting trends in CG and non-CG methylation. Abbreviations: mC, methylcytosine.
Figure 2. Bisulfite-PCR validation of non-CG DNA methylation in differentiated and stem cells
DNA methylation sequence context is displayed according to the key and the percent methylation at each position is represented by the fill of each circle (see Supplementary Table 2 for values). Non-CG methylated positions indicated by an asterisk are unique to that cell type and “+4” indicates a mCHH that is shifted 4 bases downstream in H9 cells. Abbreviations: iPS, induced pluripotent stem cell.
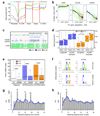
Figure 3. Non-CG DNA methylation in H1 embryonic stem cells
a, Relative methylation density (the ratio of methylcytosines to reference cytosines) in H1 throughout different gene-associated regions (promoters encompass 2 kb upstream of the transcriptional start site).The mean mC/C profile was normalized to the maximum value. b, Relative methylation density within gene bodies (y-axis) as a function of gene expression (x-axis), with transcript abundance increasing from right to left. Colored lines represent data point density and smoothing with cubic splines is displayed in black. c, Graphical representation of methylation at a non-CG methylation enriched gene, SPLICING FACTOR 1. d, Average relative methylation densities in each sequence context within gene bodies on the sense or anti-sense strand relative to gene directionality. P-values for differences between sense and antisense densities are indicated. Boxes in panels d and e represent the quartiles and whiskers mark the minimum and maximum values. e, Number of mRNA intronic reads in all genes or genes associated with non-CG enriched regions, in H1 and IMR90. P-values for differences between H1 and IMR90 reads are indicated. f, Logo plots of the sequences proximal to sites of non-CG DNA methylation in each sequence context in H1 cells. g, h, Prevalence of mCHG/mCHH sites (y-axis) as a function of the number of bases between adjacent mCHG/mCHH sites (x-axis) based on all non-redundant pair-wise distances up to 50 nt in all introns. Blue line represents smoothing with cubic splines.
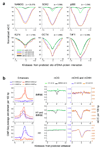
Figure 4. Density of DNA methylation at sites of DNA-protein interaction
a, Average relative DNA methylation densities 1.5 kb up- and down-stream of predicted sites of DNA-protein interaction. b, Co-localization of H3K4me1 and H3K27ac ChIP-seq tag enrichment indicative of enhancer sites that have been grouped into three sets: specific to IMR90 cells (top), H1 cells (bottom), or common to both H1 and IMR90 cells (middle). Average relative DNA methylation densities in each sequence context in 100 bp windows are displayed throughout 5 kb up- and down-stream of the enhancers in each of the sets.
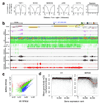
Figure 5. Cell-type variation in DNA methylation
a, Pearson correlation coefficient of mCG methylation density (y-axis) between H1 and IMR90 at various genomic features. Regions were divided in 20 equally sized bins from 5' to 3'. Pearson correlation was determined in each bin considering all the H1 and IMR90 occurrences of the given genomic region. b, DNA methylation, mRNA, and histone modifications in H1 and IMR90 associated with a PMD. Vertical lines above and below the dotted central line in DNA methylation tracks indicate methylcytosines on the Watson and Crick strands, respectively. Line vertical height indicates the methylation level. The H1 > IMR90 mC track indicates methylcytosines significantly more methylated in H1 than IMR90 at a 5% FDR (FET). Vertical bars in the mRNA and histone modification tracks represent sequence tag enrichment. A yellow box indicates any gene with ≥30 fold higher mRNA abundance in H1 than IMR90. c, Comparison of transcript abundance between H1 and IMR90 of genes with a transcriptional start site located in or within 10 kb of a PMD. Black dots indicate all genes in the genome; blue, red and green indicate PMD genes expressed ≥3-fold higher in H1, IMR90 or not differentially expressed, respectively. d Mean gene body mCG methylation (at least 10 reads required) as a function of the gene expression rank, 1 being the most expressed. Abbreviations: mC, methylcytosine. PMD, partially methylated domain.
Figure 6. Clustering of genomic, epigenetic and transcriptional features at differentially methylated regions
The density of DNA methylation, smRNA reads, strand-specific mRNA reads, and the presence of domains of H3K4me3, H3k36me3 and H3K27me3 in H1 and IMR90 was profiled through 20 kb up- and down-stream of each of the 491 DMRs where DNA methylation was more prevalent in IMR90 than H1. Open triangles indicate the central point in each window. The side colorbar indicates the difference between H1 and IMR90 mRNA levels. The location of HERVs, LINEs, and genes are displayed on each strand, where pink coloring indicates the gene body and dark red boxes represent exons. Black triangles indicate regions enriched for smRNAs that are coincident with HERVs. Group 1 and 2 are discussed in the text. Abbreviations: DMRs, Differentially Methylated Regions. HERVs, Human Endogenous Retroviruses.
Comment in
- Epigenomics: Methylation matters.
Schübeler D. Schübeler D. Nature. 2009 Nov 19;462(7271):296-7. doi: 10.1038/462296a. Nature. 2009. PMID: 19924205 No abstract available.
Similar articles
- Hotspots of aberrant epigenomic reprogramming in human induced pluripotent stem cells.
Lister R, Pelizzola M, Kida YS, Hawkins RD, Nery JR, Hon G, Antosiewicz-Bourget J, O'Malley R, Castanon R, Klugman S, Downes M, Yu R, Stewart R, Ren B, Thomson JA, Evans RM, Ecker JR. Lister R, et al. Nature. 2011 Mar 3;471(7336):68-73. doi: 10.1038/nature09798. Epub 2011 Feb 2. Nature. 2011. PMID: 21289626 Free PMC article. - Genome-wide dynamic changes of DNA methylation of repetitive elements in human embryonic stem cells and fetal fibroblasts.
Su J, Shao X, Liu H, Liu S, Wu Q, Zhang Y. Su J, et al. Genomics. 2012 Jan;99(1):10-7. doi: 10.1016/j.ygeno.2011.10.004. Epub 2011 Oct 25. Genomics. 2012. PMID: 22044633 - Disclosing the crosstalk among DNA methylation, transcription factors, and histone marks in human pluripotent cells through discovery of DNA methylation motifs.
Luu PL, Schöler HR, Araúzo-Bravo MJ. Luu PL, et al. Genome Res. 2013 Dec;23(12):2013-29. doi: 10.1101/gr.155960.113. Epub 2013 Oct 22. Genome Res. 2013. PMID: 24149073 Free PMC article. - Bisulfite methylation profiling of large genomes.
Reinders J, Paszkowski J. Reinders J, et al. Epigenomics. 2010 Apr;2(2):209-20. doi: 10.2217/epi.10.6. Epigenomics. 2010. PMID: 22121871 Review. - Epigenetics: the study of embryonic stem cells by restriction landmark genomic scanning.
Hattori N, Shiota K. Hattori N, et al. FEBS J. 2008 Apr;275(8):1624-30. doi: 10.1111/j.1742-4658.2008.06331.x. Epub 2008 Mar 7. FEBS J. 2008. PMID: 18331346 Review.
Cited by
- Effects of DNA Methylation on TFs in Human Embryonic Stem Cells.
Luo X, Zhang T, Zhai Y, Wang F, Zhang S, Wang G. Luo X, et al. Front Genet. 2021 Feb 23;12:639461. doi: 10.3389/fgene.2021.639461. eCollection 2021. Front Genet. 2021. PMID: 33708244 Free PMC article. - Multi-omics integration strategies for animal epigenetic studies - A review.
Kim DY, Kim JM. Kim DY, et al. Anim Biosci. 2021 Aug;34(8):1271-1282. doi: 10.5713/ab.21.0042. Epub 2021 Apr 23. Anim Biosci. 2021. PMID: 33902167 Free PMC article. - Evaluation of single CpG sites as proxies of CpG island methylation states at the genome scale.
Barrera V, Peinado MA. Barrera V, et al. Nucleic Acids Res. 2012 Dec;40(22):11490-8. doi: 10.1093/nar/gks928. Epub 2012 Oct 12. Nucleic Acids Res. 2012. PMID: 23066096 Free PMC article. - Base-resolution methylation patterns accurately predict transcription factor bindings in vivo.
Xu T, Li B, Zhao M, Szulwach KE, Street RC, Lin L, Yao B, Zhang F, Jin P, Wu H, Qin ZS. Xu T, et al. Nucleic Acids Res. 2015 Mar 11;43(5):2757-66. doi: 10.1093/nar/gkv151. Epub 2015 Feb 26. Nucleic Acids Res. 2015. PMID: 25722376 Free PMC article. - Identification of active regulatory regions from DNA methylation data.
Burger L, Gaidatzis D, Schübeler D, Stadler MB. Burger L, et al. Nucleic Acids Res. 2013 Sep;41(16):e155. doi: 10.1093/nar/gkt599. Epub 2013 Jul 4. Nucleic Acids Res. 2013. PMID: 23828043 Free PMC article.
References
- Holliday R, Pugh JE. DNA modification mechanisms and gene activity during development. Science. 1975;187:226–232. - PubMed
- Riggs AD. X inactivation, differentiation, and DNA methylation. Cytogenet Cell Genet. 1975;14:9–25. - PubMed
- Bestor TH. The DNA methyltransferases of mammals. Human Molecular Genetics. 2000;9:2395–2402. - PubMed
- Li E, Bestor TH, Jaenisch R. Targeted mutation of the DNA methyltransferase gene results in embryonic lethality. Cell. 1992;69:915–926. - PubMed
- Lippman Z, et al. Role of transposable elements in heterochromatin and epigenetic control. Nature. 2004;430:471–476. - PubMed
Publication types
MeSH terms
Substances
LinkOut - more resources
Full Text Sources
Other Literature Sources
Molecular Biology Databases


