Rapid modification of proteins using a rapamycin-inducible tobacco etch virus protease system - PubMed (original) (raw)
Rapid modification of proteins using a rapamycin-inducible tobacco etch virus protease system
Damian J Williams et al. PLoS One. 2009.
Abstract
Background: The ability to disrupt the function of a specific protein on a rapid time scale provides a powerful tool for biomedical research. Specific proteases provide a potential method to selectively cleave a chosen protein, but rapid control of protease activity is difficult.
Methodology/principal findings: A heterologous expression system for rapid target-directed proteolysis in mammalian cells was developed. The system consists of an inducible NIa protease from the tobacco etch virus (TEVp) and a chosen protein into which a TEVp substrate recognition sequence (TRS) has been inserted. Inducible activity was conferred to the TEVp using rapamycin-controlled TEVp fragment complementation. TEVp activity was assayed using a FRET-based reporter construct. TEVp expression was well tolerated by mammalian cells and complete cleavage of the substrate was possible. Cleavage at 37 degrees C proceeded exponentially with a time constant of approximately 150 minutes. Attempts to improve cleavage efficiency were hampered by substantial background activity, which was attributed to inherent affinity between the TEVp fragments. A second TEVp assay, based on changes in inactivation of a modified K(V)3.4 channel, showed that functional properties of a channel can be using altered using an inducible TEVp system. Similar levels of background activity and variability were observed in both electrophysiological and FRET assays.
Conclusions/significance: The results suggested that an optimum level of TEVp expression leading to sufficient inducible activity (with minimal background activity) exists but the variability in expression levels between cells makes the present system rather impractical for single cell experiments. The system is likely to be more suitable for experiments in which the cell-to-cell variability is less of an issue; for example, in experiments involving large populations of cells.
Conflict of interest statement
Competing Interests: The authors have declared that no competing interests exist.
Figures
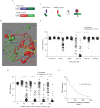
Figure 1. FRET-based assay of TEVp activity.
A) (i) A schematic representation of the FRET sensor plasmid. (ii) Diagram showing the basis of the TEVp activity assay. B) Typical unprocessed donor, FRET and acceptor images and pseudocolored FRET efficiency images calculated from the intensities of the unprocessed images. Cells displaying high (C34V alone) and low (C34V + TEVp) FRET efficiencies are shown. C) Amino acid sequence of linkers between fluorescent proteins of the FRET sensor. The TEVp recognition sequence is shown in red and the cleavage site is marked with a dashed line. Differences between the linkers are shown in bold type. D) Scatter plot showing FRET efficiencies of individual cells transfected with 100 ng of one of the FRET sensor plasmid alone and with an increasing amount of TEVp plasmid vector. The median FRET efficiency is marked with a red bar. # represents a significant difference (P<0.05) between the median FRET efficiency of control cells transfected with sensor alone (open circles) and cells co-transfected with the amount of TEVp plasmid indicated (solid circles).
Figure 2. Development of an inducible TEVp using protein fragment complementation.
A) (i) Plasmids encoding TEVp fragments (sTEVp-NT and sTEVp-CT) fused to rapamycin binding proteins (FRB and FKBP12). (ii) A representation of the rapamycin-induced complementation of sTEVp and reconstitution of protease activity. B) Crystal structure of TEVp (from [8]) represented as a cartoon showing ‘B-factor’. An increased diameter of the tube indicates a higher B-factor. The TRS of the substrate is shown in yellow and tested split sites are indicated in blue. The location of the residues required to catalyze proteolysis are shown in white. The two fragments that result from a 118/119 split are shown in green and red. C) Scatter plot showing FRET efficiencies of individual cells transfected with sTEVp constructs (split at the residues indicated). Cells were transfected with 150 ng of C34V alone, or cotransfected with 450 ng of each sTEVp plasmid. FRET efficiencies were measured from untreated cells and cells exposed to rapamycin for 3 hours. D) Scatter plot showing FRET efficiencies of individual cells transfected with different amounts of 118/119 sTEVp constructs. Measurements were taken from cells transfected with 100 ng of C34V alone, or cotransfected with the indicated amount of each sTEVp plasmid. FRET efficiencies were measured from untreated control cells and cells exposed to rapamycin for 3 hours. # represents a significant difference between control cells transfected with C34V alone and cells cotransfected with C34V and the sTEVp plasmids indicated. * represents a significant difference between cells transfected with the indicated sTEVp constructs in the absence of rapamycin (open circles) and cells exposed to 100 nM rapamycin for 3 hours (solid circles). E) A plot showing the median FRET efficiencies of different cells transfected with 300 ng of 118/119 sTEVp constructs at various time points after rapamycin addition. The time constant (τ) was calculated from a single-exponential curve fitted to the data (n = 15–30 cells at each time point).
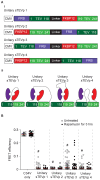
Figure 3. Unitary sTEVp constructs have a high background protease activity.
A) (i) Unitary sTEVp plasmids. Locations of the linker and the FKBP12 and FRB proteins in relation to the TEVp fragments are shown. The amino acids at the N- and C-termini of the TEVp fragments are labeled corresponding to their location in the full length TEVp. ii) Schematic diagram of the unitary sTEVp proteins. B) Scatter plot showing FRET efficiencies of individual cells transfected with unitary sTEVp constructs. Cells were transfected with 100 ng of C34V and 600 ng of the unitary sTEVp plasmid. For each construct, FRET efficiencies were measured from untreated cells (open circles) and cells treated with rapamycin for 3 hours (solid circles). # represents a significant difference between the median FRET efficiency of control cells transfected with C34V alone and cells cotransfected with C34V and the unitary sTEVp plasmid indicated.
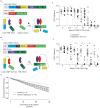
Figure 4. Fusion of the substrate to one sTEVp fragment increased background protease activity with no substantial increase in inducible protease activity.
A) _cis_-sTEVp A. (i) Plasmid expressing C34V fused to FRB-sTEVp. FKBP12-sTEVp was expressed from a second plasmid (ii) Scatter plot showing FRET efficiencies of cells transfected with 300 ng of C34V-FRB-sTEVp plasmid alone and with increasing amounts of FKBP12-sTEVp. FRET efficiencies were measured in control cells and in cells exposed to rapamycin for 3 hours. # represents a significant difference of median FRET efficiencies between the control cells transfected with C34V-FRB-sTEVp alone (first column) and cells cotransfected with the mass of FKBP12-sTEVp indicated, in the absence of rapamycin. * represents a significant difference between median FRET efficiency measured from cells in the absence of rapamycin and cells treated with 100 nM rapamycin for 3 hours. B) _cis_-sTEVp B. (i) Plasmid map and schematic diagram showing C34V fused to FKBP12-sTEVp. FRB-sTEVp-NT was expressed from a second plasmid. (ii) Scatter plot of FRET efficiencies of cells transfected with 300 ng of C34V-FKBP12-sTEVp-CT plasmid alone and with an increasing amount of FRB-sTEVp-NT. Details of the graph are equivalent to those described in part (A), above. C) Time course of _cis_-sTEVp Construct B activity. Cells were transfected with 300 ng of C34V-FKBP12-sTEVp-CT and 25 ng of FRB-sTEVp-NT. FRET efficiencies were measured from the same cells, every 30 s and were normalized to the first FRET efficiency measurement, before 100 nM rapamycin was added. The blue line represents measurements taken from control cells to which no rapamycin was added. Mean ± SE FRET efficiency data plotted.
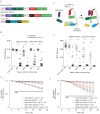
Figure 5. Targeting of one sTEVp fragment and C34V to the membrane increased both inducible and background activity of sTEVp.
A) (i) A single plasmid was used to express both sTEVp fragments. pBud-mem-sTEVp contains a Lyn11 membrane-targeting sequence fused to the N-terminus of FKBP12-sTEVp-CT. Mem-C34V has a Lyn11 sequence fused to the N-terminus of C34V. (ii) Schematic diagram showing localization of the Lyn11-modified sTEVp fragment and mem-C34V. B) Scatter plots showing FRET efficiencies of cells transfected with (i) soluble C34V and (ii) membrane-targeted C34V alone, and with 0.3 µg and 1 µg of pBud-sol-sTEVp or pBud-mem-sTEVp DNA. # represents a significant difference in median FRET efficiencies between control cells transfected with C34V alone and cells cotransfected with the indicated mass of pBud construct. * represents a significant difference of median FRET efficiency between untreated cells and cells exposed to 100 nM rapamycin for 3 hours, for a given mass of pBud-sTEVp plasmid. C) Time course of sTEVp activity. Cells transfected with 100 ng of (i) soluble C34V or (ii) membrane-targeted C34V alone, and cotransfected with 1000 ng of pBud-sol-sTEVp or pBud-mem-sTEVp. FRET efficiencies were measured every 60 seconds. Where indicated, rapamycin was added 3 minutes after the start of the experiment. FRET efficiencies were normalized to the mean FRET efficiencies measured before the addition of rapamycin. Mean ± SE FRET efficiency data plotted.
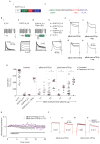
Figure 6. An electrophysiological assay of TEVp activity based on changes in inactivation of a modified KV3.4 channel.
A) TEVp activity sensor (EGFP-KV3.4) consisted of an EGFP moiety fused to the N-terminus of a human KV 3.4 subunit via a TRS. (i) EGFP-KV3.4 RNA was transcribed from a plasmid containing a T7 promoter. (ii) Amino acid sequence of the TRS region of EGFP-KV3.4. The C-terminus of EGFP is shown in green, the TRS in red, and the N-terminus of KV3.4 shown in blue. The cleavage site is marked with a dashed line. B) Schematic diagrams of KV3.4 constructs and current traces showing the basis of the KV3.4-based assay. Currents were recorded from HEK-293 cells held at −80 mV and stepped to command voltages (−80 mV to +60 mV, in 10 mV increments) for 100 ms. (i) Cells transfected with 500 ng wild-type KV3.4 RNA displayed strongly inactivating currents. (ii) Inactivation was blocked in cells transfected with 500 ng EGFP-KV3.4. (iii) Cleavage of EGFP from KV3.4 resulted in a partial recovery of inactivation in cells cotransfected with 1000 ng EGFP-KV3.4 RNA and 2 µg RFP-TEVp DNA. (iv) Current traces from different cells held at −80 mV and stepped to +50 mV for 100 ms. Currents were normalized to the same peak amplitude. Representative traces from cells transfected with (a) EGFP-KV3.4 RNA (b) EGFP-KV3.4 RNA + rap for 3 hours (c) EGFP-KV3.4 RNA + RFP-TEVp DNA (d) wild-type KV3.4 RNA. C) Typical current traces showing different levels of inactivation (normalized to the same peak amplitude) from different cells transfected with 1000 ng EGFP-KV3.4+ (i) 3 µg pBud-sol-sTEVp DNA (ii) 3 µg pBud-sol-sTEVp DNA+100 nM rap for 3 hours (iii) 3 µg pBud-mem-sTEVp (iv) pBud-mem-sTEVp+100 nM rap for 3 hours. D) Scatter plot showing the amount of current inactivation from cells transfected with the constructs described above. Inactivation was calculated using the amplitude of the current 95 ms after the start of the voltage step (I95 ms) and the peak current in the first 50 ms of the voltage step (Imax); see Methods for details. # represents a significant difference in median FRET efficiency, between the cells transfected with EGFP-KV3.4 alone (second column) and the cells transfected with the indicated pBud-sTEVp, in the absence of rapamycin. * represents a significant difference between the median FRET efficiency from cells in the absence of rapamycin and cells treated with 100 nM rapamycin for 3 hours, for a given amount of pBud-sTEVp. E) Plot showing the degree of current inactivation from cells transfected with 3 µg pBud-sTEVp after addition of 100 nM rapamycin. Recordings were made every 10 s (30 s intervals plotted for clarity) and inactivation was normalized to control currents recorded in the first 2 minutes, before rapamycin addition. Mean ± SE data plotted. F) Representative traces from cells transfected with pBud-sTEVp before (black trace) and after addition of rapamycin for 15 minutes (red trace). Examples of cells displaying currents with no inactivation (i, iii) and clear inactivation (ii, iv) in the control recordings are shown.
Similar articles
- Tobacco Etch Virus protease: A shortcut across biotechnologies.
Cesaratto F, Burrone OR, Petris G. Cesaratto F, et al. J Biotechnol. 2016 Aug 10;231:239-249. doi: 10.1016/j.jbiotec.2016.06.012. Epub 2016 Jun 13. J Biotechnol. 2016. PMID: 27312702 Review. - Cleavage of fusion proteins on the affinity resins using the TEV protease variant.
Zhu K, Zhou X, Yan Y, Mo H, Xie Y, Cheng B, Fan J. Zhu K, et al. Protein Expr Purif. 2017 Mar;131:27-33. doi: 10.1016/j.pep.2016.02.003. Epub 2016 Feb 10. Protein Expr Purif. 2017. PMID: 26876021 - A protease substrate profiling method that links site-specific proteolysis with antibiotic resistance.
Sandersjöö L, Kostallas G, Löfblom J, Samuelson P. Sandersjöö L, et al. Biotechnol J. 2014 Jan;9(1):155-62. doi: 10.1002/biot.201300234. Epub 2013 Nov 14. Biotechnol J. 2014. PMID: 24243818 - In vivo and in vitro characterization of TEV protease mutants.
Wei L, Cai X, Qi Z, Rong L, Cheng B, Fan J. Wei L, et al. Protein Expr Purif. 2012 Jun;83(2):157-63. doi: 10.1016/j.pep.2012.03.011. Epub 2012 Mar 28. Protein Expr Purif. 2012. PMID: 22484199 - Improved yield, stability, and cleavage reaction of a novel tobacco etch virus protease mutant.
Enríquez-Flores S, De la Mora-De la Mora JI, Flores-López LA, Cabrera N, Fernández-Lainez C, Hernández-Alcántara G, Guerrero-Beltrán CE, López-Velázquez G, García-Torres I. Enríquez-Flores S, et al. Appl Microbiol Biotechnol. 2022 Feb;106(4):1475-1492. doi: 10.1007/s00253-022-11786-5. Epub 2022 Jan 29. Appl Microbiol Biotechnol. 2022. PMID: 35092453 Review.
Cited by
- Enteroviral 2B Interacts with VDAC3 to Regulate Reactive Oxygen Species Generation That Is Essential to Viral Replication.
Cheng ML, Wu CH, Chien KY, Lai CH, Li GJ, Liu YY, Lin G, Ho HY. Cheng ML, et al. Viruses. 2022 Aug 4;14(8):1717. doi: 10.3390/v14081717. Viruses. 2022. PMID: 36016340 Free PMC article. - Engineering a switchable single-chain TEV protease to control protein maturation in living neurons.
Renna P, Ripoli C, Dagliyan O, Pastore F, Rinaudo M, Re A, Paciello F, Grassi C. Renna P, et al. Bioeng Transl Med. 2022 Feb 22;7(2):e10292. doi: 10.1002/btm2.10292. eCollection 2022 May. Bioeng Transl Med. 2022. PMID: 35600650 Free PMC article. - Targeted protein oxidation using a chromophore-modified rapamycin analog.
Courtney TM, Hankinson CP, Horst TJ, Deiters A. Courtney TM, et al. Chem Sci. 2021 Sep 22;12(40):13425-13433. doi: 10.1039/d1sc04464h. eCollection 2021 Oct 20. Chem Sci. 2021. PMID: 34777761 Free PMC article. - Metabolic Reprogramming of Host Cells in Response to Enteroviral Infection.
Cheng ML, Chien KY, Lai CH, Li GJ, Lin JF, Ho HY. Cheng ML, et al. Cells. 2020 Feb 18;9(2):473. doi: 10.3390/cells9020473. Cells. 2020. PMID: 32085644 Free PMC article. - MadID, a Versatile Approach to Map Protein-DNA Interactions, Highlights Telomere-Nuclear Envelope Contact Sites in Human Cells.
Sobecki M, Souaid C, Boulay J, Guerineau V, Noordermeer D, Crabbe L. Sobecki M, et al. Cell Rep. 2018 Dec 4;25(10):2891-2903.e5. doi: 10.1016/j.celrep.2018.11.027. Cell Rep. 2018. PMID: 30517874 Free PMC article.
References
- Weintraub H. The MyoD family and myogenesis: redundancy, networks, and thresholds. Cell. 1993;75:1241–1244. - PubMed
- Krumins AM, Gilman AG. Targeted knockdown of G protein subunits selectively prevents receptor-mediated modulation of effectors and reveals complex changes in non-targeted signaling proteins. J Biol Chem. 2006;281:10250–10262. - PubMed
- Routtenberg A. Knockout mouse fault lines. Nature. 1995;374:314–315. - PubMed
- Dougherty WG, Cary SM, Parks TD. Molecular genetic analysis of a plant virus polyprotein cleavage site: a model. Virology. 1989;171:356–364. - PubMed
Publication types
MeSH terms
Substances
LinkOut - more resources
Full Text Sources
Other Literature Sources

