Ly6d marks the earliest stage of B-cell specification and identifies the branchpoint between B-cell and T-cell development - PubMed (original) (raw)
Ly6d marks the earliest stage of B-cell specification and identifies the branchpoint between B-cell and T-cell development
Matthew A Inlay et al. Genes Dev. 2009.
Erratum in
- Genes Dev. 2013 Sep 15;27(18):2063
Abstract
Common lymphoid progenitors (CLPs) clonally produce both B- and T-cell lineages, but have little myeloid potential in vivo. However, some studies claim that the upstream lymphoid-primed multipotent progenitor (LMPP) is the thymic seeding population, and suggest that CLPs are primarily B-cell-restricted. To identify surface proteins that distinguish functional CLPs from B-cell progenitors, we used a new computational method of Mining Developmentally Regulated Genes (MiDReG). We identified Ly6d, which divides CLPs into two distinct populations: one that retains full in vivo lymphoid potential and produces more thymocytes at early timepoints than LMPP, and another that behaves essentially as a B-cell progenitor.
Figures
Figure 1.
Prediction of surface markers up-regulated or down-regulated during B-cell development. (A) Prediction of genes encoding cell surface molecules up-regulated in B-cell development. The MiDReG algorithm uses Boolean implications from mouse data sets only. The first seed condition is Kit high AND Mpl high, and the second seed condition is CD19 high AND CD3ɛ low. The algorithm predicted gene X such that “(Kit high AND Mpl high) ⇒ X low” and “(Cd19 high AND Cd3ɛ low) ⇒ X high.” The gene list was filtered using membrane Gene Ontology classification and commercially available antibodies suitable for flow cytometry. (∧) AND, (¬) NOT, (→) “implies.” A diagram of the expression changes between Kit and Mpl, Gene X, and Cd19 and Cd3ɛ are depicted on the right. (B) Nineteen genes encoding cell surface molecules were predicted in this analysis. (*) Gene symbol truncated for brevity. Details of the MiDReG algorithm are described elsewhere (D Sahoo, J Seita, D Bhattacharya, M Inlay, I Weissman, S Plevritis, and D Dill, in prep.). (C) Prediction of down-regulated genes. Here, the algorithm predicted gene X such that “(Kit high AND Mpl high) ⇒ X high” and “(Cd19 high AND Cd3ɛ low) ⇒ X low.” Seven genes encoding cell surface molecules were identified after applying the membrane Gene Ontology and commercial antibodies filtrations. (D) Ly6d expression profile of MPPs (light gray), CLPs (white), and pre-pro-Bs (ppB, dark gray). Fluorescence minus one (FMO, black) control is shown for Lin− cells. (E) Kit/Ly6d contour plot of MPPs, CLPs, and pre-pro-Bs. The stains and gating strategy leading to each of these populations are shown. Percentages of displayed cells within each gate are shown.
Figure 2.
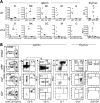
In vivo lineage potential of Ly6d− and Ly6d+ bone marrow progenitors by intravenous transplantation. (A) MPPs, Ly6d− CLPs (ALP), Ly6d+ CLPs (BLP), and pre-pro-Bs (ppB) were sorted and transplanted in physiologic proportions (∼10,000–20,000 cells per transplant) intravenously into sublethally irradiated recipients. At days 7 (top) and 14 (bottom), spleens and thymuses were harvested and analyzed for donor output in each of the four lymphoid lineages, as well as macrophages (M) and granulocytes (G). T-cell output was measured in the thymus (shown in the right column) and all other lineages in the spleen. Donor cells were congenic for two markers: (Donor) CD45.1, Thy1.2; (Host) CD45.2, Thy1.1. For spleen cells, the lineage output is shown as a fraction of total chimerism, with means indicated by horizontal bars. Thymuses were depleted of Thy1.1+ host cells prior to staining, and the absolute number of recovered T cells (DN1, DN2, DN3, DN4, DP, and SP) per thymus is shown in the right column. Data shown are a merge of four independent experiments. (na) Not analyzed. (B) Representative plots and gating strategy of donor lineages from the spleens and thymuses of intravenously transplanted MPPs, ALPs, and BLPs analyzed at day 7. The left column identifies the splenic chimerism for each sample, listed as the percentage of live cells. All other values are listed as a percentage of donor cells. Only the donor gate for the PBS-injected control (SHAM) is shown. Splenic and thymic lineages are defined as shown. In the thymus, cells shown are pregated as donor, and B220−CD19−CD11c−Mac1−Gr1−. Values of each thymus population are listed as a percentage of the total thymic donor cells (not shown).
Figure 3.
In vivo lineage potential of Ly6d− and Ly6d+ bone marrow progenitors by intrathymic transplantation. (A) Intrathymic transplants (i.t.) of MPPs, ALPs, BLPs, and pre-pro-Bs (ppB) into nonirradiated recipients. Similar proportions of cells were transplanted as in Figure 2. Thymuses were harvested at day 9, and the distribution of donor cells within each lineage is shown. Displayed are the combined results from two independent experiments. (B) Absolute number of donor T-cell output (left) and B-cell output (right) recovered from the intrathymic transplants shown in A. (C) Distribution of donor T-lineage cells from MPPs, ALPs, and BLPs, listed as a fraction of total donor T cells. Representative stains for intrathymic analyses and definitions of all lineages can be found in Supplemental Figure S7.
Figure 4.
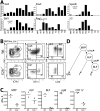
B-cell specification occurs during the ALP-to-BLP transition. (A) Quantitative RT–PCR of B-lineage genes in hematopoietic progenitors and B-committed populations in wild-type bone marrow. Samples were normalized to β-actin transcription and shown relative to the population with the highest expression of each gene. (ND) Not detected (Ct > 32 cycles). The fold change between ALPs and BLPs is shown for select genes, with an asterisk indicating statistical significance (unpaired _t_-test, n = 2, P < 0.05). Error bars are shown for the MPP, ALP, and BLP samples. (B) Wild-type and age-matched E2A−/− bone marrow were stained to examine changes in the proportions of MPP, ALP, BLP, and pre-pro-B cells. Only live lin− (Mac1−Ter119−Gr1−CD3−) and CD27+ cells are shown. Percentages within each gate are shown. (C) Absolute numbers of progenitor populations in wild-type and E2A−/− bone marrow. Absolute numbers are estimated for the two femurs, tibias, and hips of 6-wk-old mice. (D) Proposed model for the branching of the GM-cell, T-cell, and B-cell lineages from hematopoietic progenitors.
Comment in
- Developmental trajectories in early hematopoiesis.
Murre C. Murre C. Genes Dev. 2009 Oct 15;23(20):2366-70. doi: 10.1101/gad.1861709. Genes Dev. 2009. PMID: 19833763 Free PMC article.
Similar articles
- IL-7 mediates Ebf-1-dependent lineage restriction in early lymphoid progenitors.
Tsapogas P, Zandi S, Åhsberg J, Zetterblad J, Welinder E, Jönsson JI, Månsson R, Qian H, Sigvardsson M. Tsapogas P, et al. Blood. 2011 Aug 4;118(5):1283-90. doi: 10.1182/blood-2011-01-332189. Epub 2011 Jun 7. Blood. 2011. PMID: 21652681 - Plasmacytoid dendritic cells develop from Ly6D+ lymphoid progenitors distinct from the myeloid lineage.
Dress RJ, Dutertre CA, Giladi A, Schlitzer A, Low I, Shadan NB, Tay A, Lum J, Kairi MFBM, Hwang YY, Becht E, Cheng Y, Chevrier M, Larbi A, Newell EW, Amit I, Chen J, Ginhoux F. Dress RJ, et al. Nat Immunol. 2019 Jul;20(7):852-864. doi: 10.1038/s41590-019-0420-3. Epub 2019 Jun 18. Nat Immunol. 2019. PMID: 31213723 - Common-Lymphoid-Progenitor-Independent Pathways of Innate and T Lymphocyte Development.
Ghaedi M, Steer CA, Martinez-Gonzalez I, Halim TYF, Abraham N, Takei F. Ghaedi M, et al. Cell Rep. 2016 Apr 19;15(3):471-480. doi: 10.1016/j.celrep.2016.03.039. Epub 2016 Apr 7. Cell Rep. 2016. PMID: 27068476 - B-lymphocyte commitment: identifying the point of no return.
Welinder E, Ahsberg J, Sigvardsson M. Welinder E, et al. Semin Immunol. 2011 Oct;23(5):335-40. doi: 10.1016/j.smim.2011.08.005. Epub 2011 Sep 23. Semin Immunol. 2011. PMID: 21944938 Review. - Biological and molecular evidence for existence of lymphoid-primed multipotent progenitors.
Luc S, Buza-Vidas N, Jacobsen SE. Luc S, et al. Ann N Y Acad Sci. 2007 Jun;1106:89-94. doi: 10.1196/annals.1392.023. Epub 2007 Apr 18. Ann N Y Acad Sci. 2007. PMID: 17442777 Review.
Cited by
- Lymphoid origin of intrinsically activated plasmacytoid dendritic cells in mice.
Araujo AM, Dekker JD, Garrison K, Su Z, Rhee C, Hu Z, Lee BK, Osorio D, Lee J, Iyer VR, Ehrlich LIR, Georgiou G, Ippolito G, Yi S, Tucker HO. Araujo AM, et al. Elife. 2024 Sep 13;13:RP96394. doi: 10.7554/eLife.96394. Elife. 2024. PMID: 39269281 Free PMC article. - Interaction of CCR4-NOT with EBF1 regulates gene-specific transcription and mRNA stability in B lymphopoiesis.
Yang CY, Ramamoorthy S, Boller S, Rosenbaum M, Rodriguez Gil A, Mittler G, Imai Y, Kuba K, Grosschedl R. Yang CY, et al. Genes Dev. 2016 Oct 15;30(20):2310-2324. doi: 10.1101/gad.285452.116. Epub 2016 Nov 2. Genes Dev. 2016. PMID: 27807034 Free PMC article. - AP-1 and TGFß cooperativity drives non-canonical Hedgehog signaling in resistant basal cell carcinoma.
Yao CD, Haensel D, Gaddam S, Patel T, Atwood SX, Sarin KY, Whitson RJ, McKellar S, Shankar G, Aasi S, Rieger K, Oro AE. Yao CD, et al. Nat Commun. 2020 Oct 8;11(1):5079. doi: 10.1038/s41467-020-18762-5. Nat Commun. 2020. PMID: 33033234 Free PMC article. - Molecular regulation of peripheral B cells and their progeny in immunity.
Boothby MR, Hodges E, Thomas JW. Boothby MR, et al. Genes Dev. 2019 Jan 1;33(1-2):26-48. doi: 10.1101/gad.320192.118. Genes Dev. 2019. PMID: 30602439 Free PMC article. Review. - The CD11a and Endothelial Protein C Receptor Marker Combination Simplifies and Improves the Purification of Mouse Hematopoietic Stem Cells.
Karimzadeh A, Scarfone VM, Varady E, Chao C, Grathwohl K, Fathman JW, Fruman DA, Serwold T, Inlay MA. Karimzadeh A, et al. Stem Cells Transl Med. 2018 Jun;7(6):468-476. doi: 10.1002/sctm.17-0189. Epub 2018 Mar 15. Stem Cells Transl Med. 2018. PMID: 29543389 Free PMC article.
References
- Akashi K, Richie LI, Miyamoto T, Carr WH, Weissman IL. B lymphopoiesis in the thymus. J Immunol. 2000;164:5221–5226. - PubMed
- Arber C, BitMansour A, Sparer TE, Higgins JP, Mocarski ES, Weissman IL, Shizuru JA, Brown JM. Common lymphoid progenitors rapidly engraft and protect against lethal murine cytomegalovirus infection after hematopoietic stem cell transplantation. Blood. 2003;102:421–428. - PubMed
- Bain G, Maandag EC, Izon DJ, Amsen D, Kruisbeek AM, Weintraub BC, Krop I, Schlissel MS, Feeney AJ, van Roon M. E2A proteins are required for proper B cell development and initiation of immunoglobulin gene rearrangements. Cell. 1994;79:885–892. - PubMed
- Bain G, Robanus Maandag EC, te Riele HP, Feeney AJ, Sheehy A, Schlissel M, Shinton SA, Hardy RR, Murre C. Both E12 and E47 allow commitment to the B cell lineage. Immunity. 1997;6:145–154. - PubMed
Publication types
MeSH terms
Substances
Grants and funding
- K99 CA151673/CA/NCI NIH HHS/United States
- 5R01AI047458/AI/NIAID NIH HHS/United States
- T32 AI007290/AI/NIAID NIH HHS/United States
- U56 CA112973/CA/NCI NIH HHS/United States
- T32 CA009151/CA/NCI NIH HHS/United States
- R01 AI047458/AI/NIAID NIH HHS/United States
- 5U56CA112973/CA/NCI NIH HHS/United States
- F32AI058521/AI/NIAID NIH HHS/United States
- K01 DK078318/DK/NIDDK NIH HHS/United States
- T32AI0729022/AI/NIAID NIH HHS/United States
- 5R01AI047457/AI/NIAID NIH HHS/United States
- F32 AI058521/AI/NIAID NIH HHS/United States
- R01 AI047457/AI/NIAID NIH HHS/United States
- K01DK078318/DK/NIDDK NIH HHS/United States
- CA09151/CA/NCI NIH HHS/United States
LinkOut - more resources
Full Text Sources
Other Literature Sources
Molecular Biology Databases
Research Materials
Miscellaneous


