Localized and reversible TGFbeta signalling switches breast cancer cells from cohesive to single cell motility - PubMed (original) (raw)
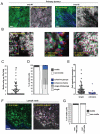
Figure 1. Transient acquisition of motile behaviour by breast cancer cells
A: i) An intravital image from a time series of an MTLn3E tumour with cells expressing GFP-actin (green) and collagen fibres (blue) shown (see Movie1). ii) Actin images from three different time points from panel i) are shown - overlay of images at different times in red, green and blue produces a white/grey image indicating no change in cell position (Figure 1Aii). iii) An intravital image from a second time series of a primary MTLn3E tumour with cells expressing GFP-actin (green) and collagen fibres (blue) shown (see Movie 1). iv) Actin images from three different time points from panel iii) are shown are shown over-laid – distinct areas of red, green and blue highlight motile cells. B: i) myr-GFP intravital primary tumour images from three different time points are shown overlaid in red, green and blue (see Movie 2). Panel ii) shows a region with rapidly moving disorganized cells, while panel iii) shows a region with slower moving cohesively organized cells. C: The number of motile cells observed per 20x field is shown. D: Left hand bar shows the proportion of non-motile and motile cells (74 movies analysed by two observers – error bar represents deviation between observers). Right hand bar shows the proportion of cells moving singly, singly but in the same path as another cell, cohesively in chains <20μm diameter and cohesively in groups >20μm diameter (74 movies analysed by two observers – error bars represent deviation between observers). E: The speed of motile cells either moving singly or cohesively is shown (>25 representative cells analysed for each category from 5 movies). F: i) An intravital image from a time series of a lymph node metastases with MTLn3E cells expressing fluorescently tagged actin (green) and collagen fibres (blue) shown. ii) Actin images from three different time points of the time-series shown in panel i) are shown overlaid in red, green and blue. G: Bars show the proportion of non-motile and motile MTLn3E cells in smaller (<100 cells) and larger (>100 cells) lymph node metastases (10 lymph nodes analysed in total).
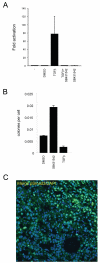
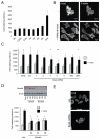
Figure 2. TGFβ signalling in MTLn3E cells
A: Assay showing changes in CAGA12-luciferase reporter activity in MTLn3E cells in response to 2ng/ml TGFβ1 +/−10μM SB431542 (an inhibitor of the TGFβ type I receptor Alk 5 - also inhibits Alk4&7). B: Soft agar assays were set up using MTLn3E cells that had been cultured in control media (+ vehicle) or with 2ng/ml TGFβ1 or 10μM SB431542 for 24 hours. Average of two experiments (error bars represent half range). C: MTLn3E tumour stained for pSmad3 (green) and DAPI (blue), tumour margin is in top right corner.
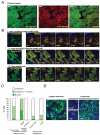
Figure 3. Nuclear accumulation of Smad2 in singly-moving cells
A: Low magnification image of a primary MTLn3E tumour expressing GFP-Smad2 and NLS-Orange. B: Time series of higher magnification images of GFP-Smad2 and NLS-Orange expressing primary tumours are shown. i), ii) and iii) show areas including singly-moving (see also Movie 6), cohesively moving (see also Movie 7), and stationary cells (see also Movie 8), respectively. C: Quantification of Smad2 localisation in non-motile, singly-moving, and collectively moving cells in primary tumours, lymph node and lung metastases. 26 movies from 6 mice were analysed D: GFP-Smad2 localisation in a lymph node metastasis and different size lung metastases.
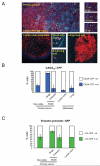
Figure 4. Activation of Smad-dependent transcription in singly-moving cells
A: i) Low magnification image of a primary MTLn3E tumour constitutively expressing myristoylated-Cherry (red) and expressing CFP (cyan) from a Smad-dependent promoter; collagen second harmonic signal is in blue. Arrows indicate motile cells – see also right-hand panels and Movie 9. ii) Image of an MTLn3E lymph node metastasis constitutively expressing myr-Cherry and expressing CFP from a Smad-dependent promoter; collagen second harmonic signal is in blue. iii-iv) Images of different size MTLn3E lung metastases constitutively expressing myr-Cherry and expressing CFP from a Smad-dependent promoter. B: Quantification of the proportion of CAGA12::CFP positive cells in non-motile, singly-moving, and collectively moving cells in primary tumours, lymph node and lung metastases. Average data from four independent clones is shown with 24 from 13 mice were analysed, standard error is shown. C: Quantification of the proportion of vimentin promoter::GFP positive cells in non-motile, singly-moving, and collectively moving cells in primary tumours and lymph node metastases. Average of two independent clones is shown.
Figure 5. TGFβ requires Smad4 to switch cells to single cell motility
A: Time course of switch to single cell motility induced by 2ng/ml TGFβ. Scattering of colonies was used as a readout of single cell motility. B: F-actin and β-catenin staining of MTLn3E cells seeded at low density in the presence or absence of TGFβ 2ng/ml for 40 hours (see also Movie 9). C: Graph shows the cell scattering 24hr after addition of 2ng/ml TGFβ in control and Smad1, 2, 3, 4, 5, 1&5 or 2&3 siRNA smartpool transfected cells (average of two or three experiments, * p<0.05, ** p<0.01 student t-test). D: Western blot showing the efficiency of Smad4 depletion using 4 different siRNA sequences. Graph shows the cell scattering 24hr after addition of 2ng/ml TGFβ following transfection of three different Smad4 siRNA sequences (averages and standard deviations from one representative experiment of three are shown, * p<0.05). E: β-catenin staining of MTLn3E cells in control and Smad4 siRNA transfected cells 24hr after addition of 2ng/ml TGFβ.
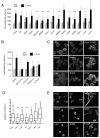
Figure 6. Roles of multiple TGFβ target genes in the switch to single cell motility
A: Graph shows the cell scattering 24hr after addition of 2ng/ml TGFβ in mock, control, RhoA, RhoC, RhoA+C, MPRIP, FARP1, RhoQ, NEDD9, FXYD5, CTGF, EGFR, PAI-1, c-Jun and JunB siRNA smartpool transfected cells (average of 2-4 experiments, * p<0.05, ** p<0.01 student t-test). B: Graph shows the cell scattering 24hr after addition of 2ng/ml TGFβ in control, 10 μM SB431542, 10 μM AG1478, 10 μM SP600125, and 10 μM Y27632 treated cells. C: β-catenin staining of MTLn3E cells in mock, control, RhoA+C, MPRIP, FARP1, NEDD9, CTGF, EGFR, and c-Jun siRNA transfected cells 24hr after addition of 2ng/ml TGFβ. D: Analysis of single ‘amoeboid’ cell motility: mock, control, RhoA+C, MPRIP, FARP1, NEDD9, CTGF, EGFR, and c-Jun siRNA transfected MTLn3E cells were plated as single cells on deformable collagen gels and the distance moved over 90 minutes was measured. Box and whisker plots show mean, quartiles and 10 and 90 percentiles (average of 2-4 experiments, * p<0.05, ** p<0.01 student t-test) E: F-actin staining of MTLn3E cells in mock, control, RhoA+C, MPRIP, FARP1, NEDD9, CTGF, EGFR, and c-Jun siRNA transfected cells plated as single cells on deformable collagen gels.
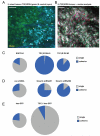
Figure 7. TGFβ signalling is required for single cell motility in vivo
A: An image from a time-series of a primary MTLn3E tumour containing a mixture of control cells expressing CFP (cyan) and cells expressing the TGFβ receptor II lacking its kinase domain fused to GFP (TGFβRDN - green), collagen fibres in blue. White arrows indicate motile cells (see also Movie 15). B: TGFβRDN-GFP intravital primary tumour images from three different time points are shown overlaid in red, green and blue. Dashed yellow line highlights a region of cohesive cell movement (see also Movie11). C: Pie charts show the number of singly- and cohesively-moving cells is for control (EGFP-N1) and two different TGFβRDN expressing MTLn3E clones. Area is proportional to the number of motile cells – ≥4 mice analysed for each condition. D: Pie charts show the number of singly- and cohesively-moving cells is shown for control shRNA and two different Smad4 shRNA expressing MTLn3E clones. Area is proportional to the number of motile cells. E: Pie charts show the number of singly- and cohesively-moving cells is shown for control IRES-GFP and TGFβ IRES-GFP expressing MTLn3E clones. Area is proportional to the number of motile cells moving.
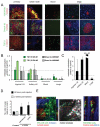
Figure 8. TGFβ signalling is required for haematogenous but not lymphatic metastasis
A: Representative images of primary tumours, lymph node metastases, intravasated cells, and lung metastases of ‘mixed’ tumours. Upper panels show mixed tumours containing control cells (red) and TGFβRDN cells (green). Middle panels show mixed tumours containing control cells (red) and Smad4shRNA cells (green). Lower panels mixed tumours containing control cells (red) and TGFβ1 over-expressing cells (green). Scale bar is 150μm. B: Quantification of metastasis of TGFβRDN and Smad4shRNA cells relative to control cells in the same mouse. Inguinal and axillary lymph nodes, circulating tumour cells and lung metastases are evaluated (average of 7, 4, 5 and 5 mice for TGFβRDN#1, TGFβRDN#2, shRNA#1 and shRNA#2, respectively). Quantification method is explained in Materials and Methods. ‘n.d’ indicates that no control or experimentally targeted cells were found in the blood. ‘0’ indicates that only control cells were detected. C: Quantification of TGFβ1 over-expressing MTLn3E metastasis relative to control cells in the same mouse. Inguinal and axillary lymph nodes, circulating tumour cells and lung metastases are evaluated (average of 8 mice – quantification performed as in part B). D: A 1:1 mixture of control cells expressing mCherry and control cells expressing GFP (columns 1&2) or control cells expressing mCherry and cells treated TGFβ1 2ng/ml for 24 hours expressing GFP (column 3) or a 1:1 mixture of control cells expressing mCherry and constitutively TGFβ1 IRES-GFP expressing cells (columns 4&5) were injected into the tail vein. 48hrs after injection the number of experimentally manipulated GFP expressing cells relative to control cells was assessed. Graph shows the ratio of GFP expressing cells to control mCherry expressing cells (the average and standard deviation from 4-6 different mice is shown). E: Left-hand image shows xy, xz, and yz sections of a ‘chain’ of MTLn3E cells (green) entering a lymphatic vessel. Middle panel shows motion analysis of the cells in the indicated region of the left-hand image. Right-hand panels show xy and yz sections of a group of cells within a lymphatic tumour draining from a mosaic tumour of control MTLn3E cells (red) and TGFβRDN MTLn3E cells (green).
