Nuclear retention of IL-1 alpha by necrotic cells: a mechanism to dampen sterile inflammation - PubMed (original) (raw)
Nuclear retention of IL-1 alpha by necrotic cells: a mechanism to dampen sterile inflammation
Nadia M Luheshi et al. Eur J Immunol. 2009 Nov.
Abstract
Sterile inflammation is a host response to tissue injury that is mediated by damage-associated molecular patterns released from dead cells. Sterile inflammation worsens damage in a number of injury paradigms. The pro-inflammatory cytokine IL-1 alpha is reported to be a damage-associated molecular pattern released from dead cells, and it is known to exacerbate brain injury caused by stroke. In the brain, IL-1 alpha is produced by microglia, the resident brain macrophages. We found that IL-1 alpha is actively trafficked to the nuclei of microglia, and hence tested the hypothesis that trafficking of IL-1 alpha to the nucleus would inhibit its release following necrotic cell death, limiting sterile inflammation. Microglia subjected to oxygen-glucose deprivation died via necrosis. Under these conditions, microglia expressing nuclear IL-1 alpha released significantly less IL-1 alpha than microglia with predominantly cytosolic IL-1 alpha. The remaining IL-1 alpha was immobilized in the nuclei of the dead cells. Thus, nuclear retention of IL-1 alpha may serve to limit inflammation following cell death.
Figures
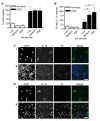
Figure 1. IL-1α nuclear localization in BV-2 microglia is inhibited by high local cell density
BV-2 microglia were left untreated (Ai) or LPS-treated (Aii, iii, B-E 1 μg/mL, 6 hours), IL-1α-immunostained (green) and co-stained with DAPI (blue). The % IL-1α-expressing cells containing nuclear IL-1α in individual fields of view was quantified by blind manual cell counting (B, C, E). IL-1α was intranuclear in some microglia (Aii, low local cell density) and cytosolic in others (Aiii, high local cell density) when microglia were cultured at 3.5 - 5 × 10⁵ cells/mL. IL-1α localization was quantified in individual fields of view from microglia seeded at 0.25 - 5 × 10⁵ cells/mL, and correlated with local cell density (B). Individual points represent single fields of view, linear regression line (solid line) R2 = 0.49 p<0.0001 vs. slope of zero. IL-1α localisation was also quantified in low density microglia (1 × 10⁵ cells/mL) cultured with or without high density microglia (1 × 10⁶ cells/mL) in transwell inserts (+TW or alone respectively, C). BV-2 microglia (1 × 10⁵ cells/mL, isolectin B-4 stained, red, IB-4) were cultured alone (Di) or with HEK-293 cells (Dii). IL-1α localisation was quantified in microglia cultured with (HEK) or without (No HEK, E) HEK-293 cells. Data from n ≥ 3 independent experiments. Scale bars = 40 μm. ***p<0.0001, Student’s t-test.
Figure 2. Intranuclear IL-1α is retained by necrotic microglia
BV-2 microglia were seeded at low, medium or high density (1, 5 and 10 × 105 cells/mL respectively), LPS-treated (1μg/mL, 3 hours) and either kept in normoxic conditions or killed by 24 hours OGD. % total LDH (A) and IL-1α (B) release into media were quantified. Data are from n = 6 independent experiments. ***p<0.001 One-way ANOVA with post-hoc Bonferroni multiple comparison test. Remaining adherent cells in normoxia- (C) and OGD-treated (D) cultures of low density (Ci, Di) and high density BV-2 cells (Cii, Dii) were IL-1α-immunostained (green) with PI (red) and DAPI (blue) co-staining. Images are from one of n = 3 independent experiments. Scale bar = 40 μm.
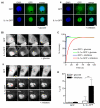
Figure 3. IL-1α-GFP is retained by necrotic COS-7 cells
COS-7 cells transiently transfected with GFP or IL-1α-GFP were killed by ATP-depletion (30 minutes, 1 μM CCCP, 15mM 2-DOG) and OGD (24 hours). Control cells were kept under normoxic conditions and trypsinised. Necrotic, detached cells and live, trypsinised cells were collected and PI-stained. Cellular GFP and PI fluorescence was measured by FACS. Scatter plots (A) show PI and GFP fluorescence intensities of necrotic cells in one representative experiment. Dashed rectangle indicates PI+/GFP+ cells. Mean GFP fluorescence of GFP and IL-1α-GFP positive COS-7 cells was measured in live, trypsinised cells and in dead, PI positive cells (C). *p<0.05, **p<0.01, ***p<0.001, One-way ANOVA with post-hoc Bonferroni multiple comparison. The proportion of GFP fluorescence retained on cell death was calculated for GFP- and IL-1α-GFP-expressing cells (D). **p<0.01, Student’s t-test. Data from n = 3 independent experiments.
Figure 4. Intranuclear IL-1α is immobilised on depletion of cellular ATP
GFP or IL-1α-GFP-expressing COS-7 cells were ATP depleted (30 minutes, “+ inhibitors”, Aii, Bii) or maintained in imaging buffer with glucose “+ glucose” Ai, Bi). Confocal images (Ai, ii) show GFP and IL-1α-GFP intranuclear distribution in DAPI stained cells. Scale bar = 10 μm. Time-lapse confocal images (B) show fluorescence recovery after photobleaching of an intranuclear ROI (red square). Scale bar = 5 μm. Mean nucleoplasmic fluorescence recovery curves (C) and half times (t1/2, D) for fluorescence recovery are shown for GFP and IL-1α-GFP expressing cells with and without ATP depletion. Data from n = 15 individual cells per construct. ***p<0.001, *p<0.05, One-way ANOVA with post-hoc Bonferroni multiple comparison test.
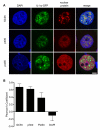
Figure 5. Intranuclear IL-1α co-localizes with nuclear speckles and p300 on depletion of cellular ATP
IL-1α-GFP-expressing (green) COS-7 cells were ATP depleted (30 minutes), immunostained for p300 (a HAT), SC35 (nuclear speckle marker) or polII0 (active transcription site marker), and DAPI co-stained. Confocal images (A) are of representative cell nuclei from one of three independent experiments. Scale bar = 5 μm. The extent of co-localization of IL-1α-GFP with nuclear proteins and DNA (DAPI) was assessed using Pearson’s co-localization analysis (B). Data are from n ≥ 20 cells per co-stain.
Similar articles
- Differential release of chromatin-bound IL-1alpha discriminates between necrotic and apoptotic cell death by the ability to induce sterile inflammation.
Cohen I, Rider P, Carmi Y, Braiman A, Dotan S, White MR, Voronov E, Martin MU, Dinarello CA, Apte RN. Cohen I, et al. Proc Natl Acad Sci U S A. 2010 Feb 9;107(6):2574-9. doi: 10.1073/pnas.0915018107. Epub 2010 Jan 25. Proc Natl Acad Sci U S A. 2010. PMID: 20133797 Free PMC article. - Cooling and Sterile Inflammation in an Oxygen-Glucose-Deprivation/Reperfusion Injury Model in BV-2 Microglia.
Lücht J, Rolfs N, Wowro SJ, Berger F, Schmitt KRL, Tong G. Lücht J, et al. Mediators Inflamm. 2021 Nov 5;2021:8906561. doi: 10.1155/2021/8906561. eCollection 2021. Mediators Inflamm. 2021. PMID: 34776788 Free PMC article. - Intracellular interleukin-1 receptor 2 binding prevents cleavage and activity of interleukin-1α, controlling necrosis-induced sterile inflammation.
Zheng Y, Humphry M, Maguire JJ, Bennett MR, Clarke MC. Zheng Y, et al. Immunity. 2013 Feb 21;38(2):285-95. doi: 10.1016/j.immuni.2013.01.008. Epub 2013 Feb 7. Immunity. 2013. PMID: 23395675 Free PMC article. - Molecular determinants of sterile inflammation.
Kono H, Onda A, Yanagida T. Kono H, et al. Curr Opin Immunol. 2014 Feb;26:147-56. doi: 10.1016/j.coi.2013.12.004. Epub 2014 Jan 7. Curr Opin Immunol. 2014. PMID: 24556412 Review. - Constitutive DAMPs in CNS injury: From preclinical insights to clinical perspectives.
Castellanos-Molina A, Bretheau F, Boisvert A, Bélanger D, Lacroix S. Castellanos-Molina A, et al. Brain Behav Immun. 2024 Nov;122:583-595. doi: 10.1016/j.bbi.2024.07.047. Epub 2024 Aug 31. Brain Behav Immun. 2024. PMID: 39222725 Review.
Cited by
- The IL-1 cytokine family and its role in inflammation and fibrosis in the lung.
Borthwick LA. Borthwick LA. Semin Immunopathol. 2016 Jul;38(4):517-34. doi: 10.1007/s00281-016-0559-z. Epub 2016 Mar 21. Semin Immunopathol. 2016. PMID: 27001429 Free PMC article. Review. - Chromatin regulates IL-33 release and extracellular cytokine activity.
Travers J, Rochman M, Miracle CE, Habel JE, Brusilovsky M, Caldwell JM, Rymer JK, Rothenberg ME. Travers J, et al. Nat Commun. 2018 Aug 14;9(1):3244. doi: 10.1038/s41467-018-05485-x. Nat Commun. 2018. PMID: 30108214 Free PMC article. - The common IL1A single nucleotide polymorphism rs17561 is a hypomorphic mutation that significantly reduces interleukin-1α release from human blood cells.
Wiggins KA, Pyrillou K, Humphry M, Butterworth AS, Clarke MC. Wiggins KA, et al. Immunology. 2023 Mar;168(3):459-472. doi: 10.1111/imm.13584. Epub 2022 Oct 13. Immunology. 2023. PMID: 36175368 Free PMC article. - Interleukin-1α expression precedes IL-1β after ischemic brain injury and is localised to areas of focal neuronal loss and penumbral tissues.
Luheshi NM, Kovács KJ, Lopez-Castejon G, Brough D, Denes A. Luheshi NM, et al. J Neuroinflammation. 2011 Dec 29;8:186. doi: 10.1186/1742-2094-8-186. J Neuroinflammation. 2011. PMID: 22206506 Free PMC article. - Role of brain transmigrating neutrophils in depression-like behavior during systemic infection.
Aguilar-Valles A, Kim J, Jung S, Woodside B, Luheshi GN. Aguilar-Valles A, et al. Mol Psychiatry. 2014 May;19(5):599-606. doi: 10.1038/mp.2013.137. Epub 2013 Oct 15. Mol Psychiatry. 2014. PMID: 24126927
References
- Chen CJ, Kono H, Golenbock D, Reed G, Akira S, Rock KL. Identification of a key pathway required for the sterile inflammatory response triggered by dying cells. Nat.Med. 2007;13:851–856. - PubMed
- Dinarello CA. Immunological and inflammatory functions of the interleukin-1 family. Annu.Rev.Immunol. 2009;27:519–550. - PubMed
- Allan SM, Tyrrell PJ, Rothwell NJ. Interleukin-1 and neuronal injury. Nat.Rev.Immunol. 2005;5:629–640. - PubMed
Publication types
MeSH terms
Substances
LinkOut - more resources
Full Text Sources
Molecular Biology Databases


