Loss of myosin VI no insert isoform (NoI) induces a defect in clathrin-mediated endocytosis and leads to caveolar endocytosis of transferrin receptor - PubMed (original) (raw)
Loss of myosin VI no insert isoform (NoI) induces a defect in clathrin-mediated endocytosis and leads to caveolar endocytosis of transferrin receptor
Claudia Puri. J Biol Chem. 2009.
Abstract
Myosin VI is a motor protein that moves toward the minus end of actin filaments. It is involved in clathrin-mediated endocytosis and associates with clathrin-coated pits/vesicles at the plasma membrane. In this article the effect of the loss of myosin VI no insert isoform (NoI) on endocytosis in nonpolarized cells was examined. The absence of myosin VI in fibroblasts derived from the Snell's waltzer mouse (myosin VI knock-out) gives rise to defective clathrin-mediated endocytosis with shallow clathrin-coated pits and a strong reduction in the internalization of clathrin-coated vesicles. To compensate for this defect in clathrin-mediated endocytosis, plasma membrane receptors such as the transferrin receptor (TfR) are internalized by a caveola-dependent pathway. Moreover the clathrin adaptor protein, AP-2, necessary for TfR internalization, follows the receptor and relocalizes in caveolae in Snell's waltzer fibroblasts.
Figures
FIGURE 1.
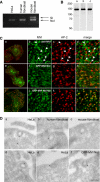
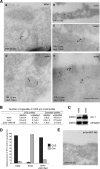
The myosin VI NoI isoform localizes to CCS at the plasma membrane. A, PCR analysis of myosin VI isoforms expressed in nonpolarized cells. HeLa cells and human wild type fibroblasts express the myosin VI NoI isoform, whereas mouse wild type fibroblasts express both the NoI and the SI isoforms. B, Western blot analysis of HeLa whole cell lysates using different myosin VI antibodies: an antibody against the C-terminal tail (lane a), an antibody against the whole tail (lane b), and the C-terminal tail of myosin VI (lane c). C, co-localization of myosin VI (a–d), GFP-myosin VI NoI (e–h), and GFP-myosin VI NoI tail (i–l) with AP-2. The boxes in the merged image in a, e, and i indicate the areas enlarged in the adjacent panels b–d, f–h, and j–l, respectively. Arrows indicate examples of co-localization. D, to visualize myosin VI localization at the ultrastructural level in unpolarized cells, cryosections of HeLa cells and human and mouse wild type fibroblasts were immunogold-labeled with a commercial antibody to the C-terminal region of myosin VI (a–c), an antibody to the whole tail (d), or an antibody the C-terminal tail of myosin VI (e). Cryosections of HeLa cells expressing GFP-myosin VI NoI were labeled with an antibody against GFP (f). Bars: a, 200 nm; b, 200 nm; c, 300 nm; d, 200 nm; e, 200 nm; f, 200 nm.
FIGURE 2.
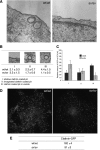
Ultrastructural analysis of CCS at the plasma membrane in Snell's waltzer mouse fibroblasts. A, for ultrastructural analysis of CCS at the plasma membrane, wt/wt, and sv/sv fibroblasts were processed for Epon-embedding EM. Representative electron micrographs of wt/wt and sv/sv fibroblasts indicate that sv/sv fibroblasts show a higher number of shallow CCP and a lower number of invaginated CCP or CCS without connection to the plasma membrane Bars: wt/wt, 200 nm; sv/sv, 500 nm. B, results of a morphometric analysis counting CCS in 10 cell profiles and normalized for 1000 μm of cell perimeter in four different experiments (±S.D.) are shown. For quantitation the CCS were divided into three different categories: I, shallow CCP; II, deeper invaginated CCP; and III, clathrin-coated pits or vesicles with no obvious connection with the plasma membrane. C, a histogram of the relative amounts of the three different categories of CCS in wt/wt or sv/sv fibroblasts. D, wt/wt and sv/sv mouse fibroblasts were transfected with GFP-tagged clathrin light chain and analyzed by epifluorescence microscope. E, TIRF microscopy was used to score 500 fields from each of the samples in the experiment shown in D, and the fields were analyzed by Volocity software to quantify the amount of clathrin structures in the two different cell lines. The numbers are an expression of the average intensity of GFP-clathrin in the different fields ± S.E.
FIGURE 3.
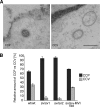
sv/sv fibroblasts internalize only a few clathrin-coated pits as shown by ruthenium red staining. A, to distinguish between a clathrin-coated pit (CCP) and a clathrin-coated vesicle (CCV), wt/wt mouse fibroblasts and two Snell's waltzer cell lines (sv/sv 1 and sv/sv 2) were fixed in the presence of the plasma membrane dye ruthenium red. EM images show a representative example of clathrin-coated pit ruthenium red-positive and -negative structures. Bar, 120 nm. B, morphometric quantitation of clathrin-coated pits and clathrin-coated vesicles present in wt/wt, sv/sv 1, sv/sv 2, and the rescue cell line (sv/sv + MVI NoI) expressing full-length myosin VI NoI. Analysis was performed on 100 CCS in two independent experiments ± S.D. The results are plotted in a histogram showing the relative amounts of clathrin-coated pits and clathrin-coated vesicles in wt/wt and sv/sv cell lines.
FIGURE 4.
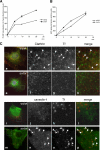
Transferrin uptake in sv/sv fibroblasts. wt/wt and sv/sv fibroblasts were incubated in the presence of Tf-HRP in a continuous uptake assay (A) or with HRP at 37 °C for different times (min) (B). The amount of Tf-HRP or HRP internalized was determined as described under “Experimental Procedures.” The amount of Tf-HRP internalized in the continuous uptake assay is expressed as a percentage of the transferrin bound on the plasma membrane. C, wt/wt (a–d and i–l) and sv/sv (e–h and m–p) fibroblasts were incubated for 15 min at 37 °C with Tf-Alexa-555 (red) and co-localized with caveolin-1 or clathrin (green). The boxes in b–d, f–h, j–l, and n–p indicate the areas enlarged in adjacent panels a, e, i, and m. Arrows indicate examples of co-localization.
FIGURE 5.
The TfR is present in caveolae in sv/sv fibroblasts. A, to visualize the TfR in endocytic structures at the plasma membrane, cryosections of wt/wt and sv/sv fibroblasts were labeled with antibodies to the TfR (a and b) and to caveolin-1 and TfR (c–e). Whereas in wt/wt fibroblasts only the TfR is present in CCS (a and d), in sv/sv fibroblasts the TfR is almost completely relocated to uncoated structures (b) and to caveolin-1 (cav1) positive structures (c and e). Bars: a, 350 nm; b, 350; c, 250 nm; d, 350 nm; e, 300 nm. B, to quantify these observations a morphometric analysis was carried out to determine the labeled and unlabeled organelles in 1000 μm of cell profiles. The relative amounts of TfR in CCS or caveolae in two independent experiments ± S.D. are shown. C, the Western blot shows an increase in caveolin-1 expression in sv/sv compared with wt/wt fibroblasts. An anti-calregulin blot is shown as the loading control. D, the histogram summarizes the relative amounts of TfR present in CCS or caveolae. E, cryosections of sv/sv fibroblasts transfected with GFP full-length myosin VI NoI (sv/sv + MVI NoI) were labeled with antibodies to GFP to localize myosin VI. The construct binds clathrin-coated structures at the plasma membrane. Bar, 350 nm.
FIGURE 6.
Human fibroblasts expressing the myosin VI mutant (wt/C442Y) show a relocalization of the TfR to caveolae. A, wt/wt and sv/sv fibroblasts were loaded with Tf-Alexa-555, labeled with caveolin-1, and observed by confocal microscope. As in sv/sv fibroblasts, the wt/C442Y-expressing human fibroblasts show a relocalization of transferrin to caveolae compared with the wt/wt. B, cryosections of human fibroblasts (wt/C442Y) and control human fibroblasts (wt/wt) were double labeled with antibodies against caveolin-1 (cav1) and TfR. The electron micrographs show representative fields, where the TfR is present in CCS in wt/wt cells and in caveolae in mutant wt/C442Y fibroblasts. Bar, 300 nm. C, to quantify this observation, a morphometric analysis was carried out to count the number of organelles in 1000 μm of cell profiles in human wt/wt or mutant wt/C442Y fibroblasts in two different experiments. D, the results of the morphometric analysis are shown in the histograms highlighting the redistribution of the TfR from CCS to caveolae in wt/C442Y fibroblasts, which carry a mutation in the motor domain in the myosin VI gene.
FIGURE 7.
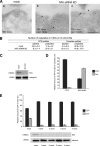
Depletion of myosin VI in HeLa cells using siRNA knockdown relocates the TfR from CCS to caveolae. HeLa cells were either mock-transfected or transfected twice with siRNAs specific to myosin VI or to myosin VI and caveolin-1. A, mock-treated HeLa cells and KD cells were loaded with mouse anti-TfR antibody at 37 °C before fixation and processing for immuno-EM. Ultrathin cryosections were double labeled with anti-caveolin-1 and rabbit anti-mouse antibodies to visualize TfR. Representative electron micrographs show the localization of the TfR in CCS in control cells and co-localization with caveolin-1 in myosin VI KD cells. Bars: a, 250 nm; b, 200 nm; c, 200 nm. B, to quantify this observation a morphometric analysis was carried out to determine the numbers of TfR-labeled and unlabeled organelles in 1000 μm of cell profiles of mock-treated and myosin VI KD cells. The relative amounts of TfR in CCS or caveolae in two independent experiments ± S.D. are shown. C, the amount of myosin VI in the cells is shown in the Western blot with calregulin as a loading control. D, the histogram shows the relative amounts of TfR in caveolae and CCS in mock and siRNA MVI KD cells. E, HeLa cells were transfected with SureSilencingTM myosin VI small hairpin RNA plasmids (SuperArray-Bioscience Corp.) carrying the puromycin resistance gene. The puromycin resistance HeLa cell population was subcloned, and four clones expressing no significant level of myosin VI were selected. The four clones and the negative control were fixed under steady state conditions using the same labeling protocol with ruthenium red/glutaraldehyde described previously for mouse fibroblasts. All four HeLa clones that down-regulate myosin VI show a 5–6-fold reduction in clathrin-coated vesicle (CCV) internalization compared with the negative control. CCP, clathrin-coated pits.
FIGURE 8.
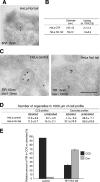
Overexpression of the dominant negative myosin VI NoI tail leads to defective clathrin-coated vesicles with relocalization of TfR to the caveolae. A, HeLa cells expressing GFP-tagged myosin VI NoI tail and control cells were processed for immuno-EM. The picture shows a representative field of HeLa cells expressing GFP-tagged myosin VI NoI tail. Ultrathin cryosections labeled with GFP antibodies show localization of GFP-myosin VI NoI tail in CCS at the plasma membrane. Bar, 200 nm. B, the size of CCS (diameter) and the transferrin receptor loading was measured in 70 cell profiles of control (CTR) and myosin VI NoI tail-expressing cells. C, cryosections of control and myosin VI NoI tail-expressing cells were double labeled with anti-caveolin-1 (cav1) and anti-TfR antibodies. Representative electron micrographs highlight localization of the TfR in caveolae in myosin VI NoI tail-expressing cells. Bar, 200 nm. D, morphometric quantitation was performed on cryosections of control and myosin VI NoI tail-expressing cells labeled with antibodies against caveolin-1 and TfR. E, the histograms represent the relative amount of Tf receptor localized on clathrin-coated structures versus caveolae.
FIGURE 9.
The transferrin receptor is internalized by caveolae when myosin VI is lost. A, sv/sv and wt/wt cells were serum-starved and incubated with filipin (1.2 μg/ml), cholesterol/filipin (1 m
m
and 1.2 μg/ml), C8-LacCer (10 μm), and Dynasore (120 m
m
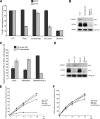
), and the Tf-HRP uptake protocol described under “Experimental Procedures” was performed. CTR, control. B, HeLa cells were transfected twice with siRNA specific to myosin VI or myosin VI and caveolin-1 (cav-1). The amount of myosin VI or myosin VI and caveolin-1 in the cells is shown in the Western blot with calnexin as the loading control. C, these HeLa mock cells or cells lacking myosin VI or myosin VI and caveolin-1 were loaded with anti-TfR antibody for 5 min and fixed for immunogold labeling on cryosections. Morphometric analysis was performed by counting the amount of receptors still at the plasma membrane (PM) or already internalized inside the cell. TIR, total internal reflections. D, HeLa cells were transfected twice with siRNA specific to myosin VI, caveolin-1, or myosin VI and caveolin-1. The amounts of myosin VI and caveolin-1 in the mock and knockdown cells are shown on a Western blot, and calregulin is used as the loading control. E, HeLa cells analyzed in D were loaded with Tf-HRP in the continuous uptake assay for different times (min). The enzyme activity of Tf-HRP internalized at the different time points and in the different mock and knockdown cells was measured. The graph shows the amount of Tf-HRP internalized in mock, caveolin-1, myosin VI, and myosin VI/caveolin-1 siRNA KD cells expressed as a percentage of the plasma membrane amount of transferrin. F, HeLa cells analyzed in D were loaded with the fluid phase marker HRP. The graph shows the enzyme activity at different time points in the different mock and knockdown cells.
FIGURE 10.
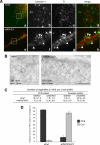
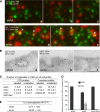
The clathrin adaptor protein, AP-2, relocalizes into caveolae when myosin VI is lost. A, wt/wt and sv/sv fibroblasts were fixed under steady state condition and labeled with anti-caveolin-1 anti-AP-2 antibodies. The samples were observed by TIRF microscopy. The figure shows different fields of the wt/wt (a–c) and sv/sv (d and e) labeled samples. In sv/sv images, AP-2 co-localizes with caveolin-1 (arrows), whereas in the wt/wt images they are completely independent. B, similar experiment was performed by immuno-EM. Cryosections of wt/wt (a) and sv/sv (b and c) fibroblasts were double labeled with anti-caveolin-1 (cav-1) and anti-AP-2 antibodies. Using this different technique a relocalization of the clathrin adaptor protein AP-2 in caveolae was also observed. Bars: a, 300 nm; b, 200 nm; c, 300 nm. C, to quantify this observation a morphometric analysis was carried out on AP-2 labeling in CCS or caveolae organelles in 1000 μm of cell profiles of wt/wt and sv/sv fibroblasts. AP-2 localization on clathrin-coated structures was restored when the myosin VI NoI isoform was re-expressed in sv/sv fibroblasts. D, the relative amounts of AP-2 in CCS or caveolae in two independent experiments ± S.D. are shown. E, wt/wt and sv/sv fibroblasts were loaded with Tf-Alexa-555 and labeled with anti-AP-2 antibody. 500 fields of each sample were scanned by TIRF microscope and analyzed by Volocity software. The percentage of co-localization between AP-2 and transferrin does not change between wt/wt and sv/sv fibroblasts, revealing that the clathrin adaptor follows the transferrin receptor whether it is internalized by clathrin or caveolae.
Similar articles
- Myosin VI isoform localized to clathrin-coated vesicles with a role in clathrin-mediated endocytosis.
Buss F, Arden SD, Lindsay M, Luzio JP, Kendrick-Jones J. Buss F, et al. EMBO J. 2001 Jul 16;20(14):3676-84. doi: 10.1093/emboj/20.14.3676. EMBO J. 2001. PMID: 11447109 Free PMC article. - Clathrin-mediated endocytosis in AP-2-depleted cells.
Motley A, Bright NA, Seaman MN, Robinson MS. Motley A, et al. J Cell Biol. 2003 Sep 1;162(5):909-18. doi: 10.1083/jcb.200305145. J Cell Biol. 2003. PMID: 12952941 Free PMC article. - Myosin VI, a new force in clathrin mediated endocytosis.
Buss F, Luzio JP, Kendrick-Jones J. Buss F, et al. FEBS Lett. 2001 Nov 23;508(3):295-9. doi: 10.1016/s0014-5793(01)03065-4. FEBS Lett. 2001. PMID: 11728438 Review. - The adaptor protein Dab2 sorts LDL receptors into coated pits independently of AP-2 and ARH.
Maurer ME, Cooper JA. Maurer ME, et al. J Cell Sci. 2006 Oct 15;119(Pt 20):4235-46. doi: 10.1242/jcs.03217. Epub 2006 Sep 19. J Cell Sci. 2006. PMID: 16984970 - [The role of actin cytoskeleton and myosin VI in clathrin-dependent endocytosis].
Zakrzewsky P, Lenartowska M. Zakrzewsky P, et al. Postepy Biochem. 2014;60(3):323-32. Postepy Biochem. 2014. PMID: 26263762 Review. Polish.
Cited by
- Iron Accumulation and Lipid Peroxidation in the Aging Retina: Implication of Ferroptosis in Age-Related Macular Degeneration.
Zhao T, Guo X, Sun Y. Zhao T, et al. Aging Dis. 2021 Apr 1;12(2):529-551. doi: 10.14336/AD.2020.0912. eCollection 2021 Apr. Aging Dis. 2021. PMID: 33815881 Free PMC article. Review. - PICALM modulates autophagy activity and tau accumulation.
Moreau K, Fleming A, Imarisio S, Lopez Ramirez A, Mercer JL, Jimenez-Sanchez M, Bento CF, Puri C, Zavodszky E, Siddiqi F, Lavau CP, Betton M, O'Kane CJ, Wechsler DS, Rubinsztein DC. Moreau K, et al. Nat Commun. 2014 Sep 22;5:4998. doi: 10.1038/ncomms5998. Nat Commun. 2014. PMID: 25241929 Free PMC article. - Arf6 promotes autophagosome formation via effects on phosphatidylinositol 4,5-bisphosphate and phospholipase D.
Moreau K, Ravikumar B, Puri C, Rubinsztein DC. Moreau K, et al. J Cell Biol. 2012 Feb 20;196(4):483-96. doi: 10.1083/jcb.201110114. J Cell Biol. 2012. PMID: 22351926 Free PMC article. - Myosin VI and Associated Proteins Are Expressed in Human Macrophages but Do Not Play a Role in Foam Cell Formation in THP-1 Cells.
Dawson HJ, Hibbert AP, Chantler PD, Botham KM. Dawson HJ, et al. Int J Vasc Med. 2013;2013:516015. doi: 10.1155/2013/516015. Epub 2013 Jun 9. Int J Vasc Med. 2013. PMID: 23840954 Free PMC article. - Myosin VI and cardiomyopathy: Left ventricular hypertrophy, fibrosis, and both cardiac and pulmonary vascular endothelial cell defects in the Snell's waltzer mouse.
Hegan PS, Lanahan AA, Simons M, Mooseker MS. Hegan PS, et al. Cytoskeleton (Hoboken). 2015 Aug;72(8):373-87. doi: 10.1002/cm.21236. Cytoskeleton (Hoboken). 2015. PMID: 26265212 Free PMC article.
References
- Mayor S., Pagano R. E. (2007) Nat. Rev. Mol. Cell Biol. 8, 603–612 - PubMed
- Orth J. D., Krueger E. W., Weller S. G., McNiven M. A. (2006) Cancer Res. 66, 3603–3610 - PubMed
- Zhu J. X., Goldoni S., Bix G., Owens R. T., McQuillan D. J., Reed C. C., Iozzo R. V. (2005) J. Biol. Chem. 280, 32468–32479 - PubMed
Publication types
MeSH terms
Substances
LinkOut - more resources
Full Text Sources
Molecular Biology Databases
Research Materials
