Novel association of APC with intermediate filaments identified using a new versatile APC antibody - PubMed (original) (raw)
Novel association of APC with intermediate filaments identified using a new versatile APC antibody
Yang Wang et al. BMC Cell Biol. 2009.
Abstract
Background: As a key player in suppression of colon tumorigenesis, Adenomatous Polyposis Coli (APC) has been widely studied to determine its cellular functions. However, inconsistencies of commercially available APC antibodies have limited the exploration of APC function. APC is implicated in spindle formation by direct interactions with tubulin and microtubule-binding protein EB1. APC also interacts with the actin cytoskeleton to regulate cell polarity. Until now, interaction of APC with the third cytoskeletal element, intermediate filaments, has remained unexamined.
Results: We generated an APC antibody (APC-M2 pAb) raised against the 15 amino acid repeat region, and verified its reliability in applications including immunoprecipitation, immunoblotting, and immunofluorescence in cultured cells and tissue. Utilizing this APC-M2 pAb, we immunoprecipitated endogenous APC and its binding proteins from colon epithelial cells expressing wild-type APC. Using Liquid Chromatography Tandem Mass Spectrometry (LC-MS/MS), we identified 42 proteins in complex with APC, including beta-catenin and intermediate filament (IF) proteins lamin B1 and keratin 81. Association of lamin B1 with APC in cultured cells and human colonic tissue was verified by co-immunoprecipitation and colocalization. APC also colocalized with keratins and remained associated with IF proteins throughout a sequential extraction procedure.
Conclusion: We introduce a versatile APC antibody that is useful for cell/tissue immunostaining, immunoblotting and immunoprecipitation. We also present evidence for interactions between APC and IFs, independent of actin filaments and microtubules. Our results suggest that APC associates with all three major components of the cytoskeleton, thus expanding potential roles for APC in the regulation of cytoskeletal integrity.
Figures
Figure 1
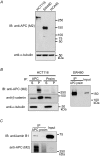
Lamin B1 co-precipitates with endogenous APC using APC-M2 pAb. (A) APC-M2 pAb specifically detects full-length (~310 kDa) APC in HCT116βw cell lysates and truncated (~150 kDa) APC in SW480 cell lysates by immunoblot. APC-M2 pAb does not detect APC in HCA46 cell lysates, null for APC. Equivalent total protein (30 μg) was resolved in each lane. Blot shows entire spectrum of proteins from > 300 kDa to ~15 kDa. α-tubulin is shown as a loading control. (B) APC-M2 pAb immunoprecipitates APC from HCT116βw (left panel) and SW480 (right panel) cell lysates. β-catenin co-precipitates with full-length APC (left panel, middle blot). Neither APC nor β-catenin co-precipitated with preimmunue sera (Preim). P, precipitated proteins from 270 μg protein lysates; S, 10% of non-precipitated supernatant proteins (27 μg). Input, 5% of total input proteins (25 μg). (C) Endogenous lamin B1 co-precipitated with APC using APC-M2 pAb, but not preimmune sera. Precipitated proteins from 376 μg protein lysates were loaded. Input, 6% of total input proteins (37.5 μg). The lower band in the APC IP lane represents degradation products.
Figure 2
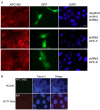
APC-M2 pAb recognizes endogenous and exogenous APC protein by immunofluorescence microscopy. (A) U2OS cells double-labeled with APC-M2 pAb (red) and commercial anti-APC (ali12-28) mAb (green). (b) Magnified image of a region indicated in (a) shows considerable overlap of red and green signals. Scale bars, 5 μm. (B) Colocalization of APC1417 fused-GFP (green, upper panel) or NLS (nuclear localization signal from SV40) fused-GFP tag (green, lower panel) with APC-M2 pAb (red) signal. Short exposure revealed APC-M2 pAb signal overlapping that of GFP-APC1417. Longer (normal) exposure led to saturated signal in GFP-APC1417-expressing cells but allowed visualization of endogenous APC staining with APC-M2 pAb in adjacent non-transfected HCT116βw cells. Note that there is no overlap of APC-M2 pAb labeling with NLS fused GFP signal. Scale bar, 5 μm.
Figure 3
APC-M2 pAb immunofluorescence signal reduced by APC-shRNA. (A) U2OS cells transfected for 48 hours with negative control shRNA or one of two individual shRNA plasmids specific for APC were probed using APC-M2 pAb. GFP (green) expression from the shRNA vector marks transfected cells. Expression of either shRNA-APC number 5 or 6 resulted in reduction of the majority of the nuclear and cytoplasmic APC-M2 pAb signal. Scale bar, 5 μm. (B) Immunofluorescence microscopy using APC-M2 pAb to probe HCA46 cells, null for APC (upper panel), or purified rabbit IgG to probe HCT116βw cells (lower panel) reveals only minimal signal. Scale bars, 5 μm.
Figure 4
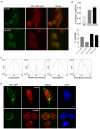
IF proteins lamin B1 and keratins colocalize with endogenous and exogenous APC in cultured cells. (A) Confocal immunofluorescence microscopy reveals partial overlap of APC (red) and keratin (green) or lamin B1 (green) in HCT116βw cells. Single projections of 20 images resolved along the z-axes for lamin and 30 images for keratin are shown. Scale bar, 4.6 μm. (B) More than 700 individual images were analyzed for each protein pair examined to determine the Pearson's correlation coefficient (upper graph) or the Manders overlap coefficient (lower graph). Additional file 4B shows representative image of the negative control (both secondary antibodies with no primary antibody). The average Pearson's correlation coefficient ± SEM calculated from n individual z-series images (n = 900, keratin/APC; n = 720, lamin B1/APC) were significantly higher than the correlation coefficient determined for the negative control (* and ** p < 0.0001). (C) The Van Steeples cross correlation function (CCF) was plotted as a function of image offset in pixels. Keratin and lamin B1 each show a peak of correlation with the APC signal in the original position with no offset (dx, red line). In contrast, the CCF is low, with multiple peaks for keratin or lamin B1 with a randomized APC signal. (D) HCT116βw cells expressing full-length APC fused to GFP were stained for keratin or lamin B1 (red). Confocal images show partial overlap of the keratin and lamin B1 signals with GFP. Scale bars, 5 μm.
Figure 5
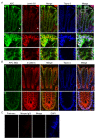
APC colocalizes with lamin B1 in human colonic tissue. (A) Confocal immunofluorescence microscopy of cryosections from normal human colon tissues triple-labeled with APC-M2 pAb (green), anti-lamin B1 (red) and DNA dye topro-3 (blue). Arrows point to stromal cells in which lamin B1 staining is more intense compared to adjacent epithelial cells within crypts. In contrast, less APC staining is detected in stromal cells compared to crypt epithelial cells. Tissues are oriented such that luminal surfaces are at the top of the images. (b) and (c) Enlarged images of two regions indicated in (a). (B) APC colocalizes with β-catenin in the cytoplasm and cell junctions of human colonic crypts. (b) Enlarged image of a region at the base a colonic crypt shown in (a). (C) Immunofluorescence microscopy using preimmune sera and purified mouse IgG to probe consecutive tissue sections revealed only minimal signal. Scale bars, 20 μm.
Figure 6
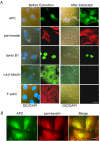
APC remains associated with IF proteins following extraction of actin and tubulin. (A) Left two panels, 184A1 epithelial cells analyzed by immunofluorescence microscopy reveal distribution of APC, lamin B1, keratin, tubulin, actin (detected with phalloidin) and DNA (blue in DIC overlay). Right two panels, following sequential extraction, APC remained cell associated, along with IF proteins lamin B1 and keratin. Note that actin, tubulin, and DNA were successfully extracted from these cells. Nuclei are indicated by DAPI staining. (B) Colocalization of APC (green) with keratins (red) after cell extraction. Scale bars, 10 μm.
Figure 7
APC-M2 pAb recognizes endogenous APC protein in normal mouse intestinal tissue. Confocal immunofluorescence microscopy of cryosections from wild-type mouse ileum triple-labeled with APC-M2 pAb (green), β-catenin mAb (red) and DNA dye topro-3 (blue). Tissues are oriented so that luminal surfaces are at the top of the images. (A) An increasing gradient of APC staining from crypts to villus tips is apparent at this magnification. (B) Enlarged image of a region at the villus tip shown in (A). APC staining is concentrated in basolateral regions of villus epithelial cells. Scale bars, 20 μm.
Similar articles
- The adenomatous polyposis coli-binding protein EB1 is associated with cytoplasmic and spindle microtubules.
Berrueta L, Kraeft SK, Tirnauer JS, Schuyler SC, Chen LB, Hill DE, Pellman D, Bierer BE. Berrueta L, et al. Proc Natl Acad Sci U S A. 1998 Sep 1;95(18):10596-601. doi: 10.1073/pnas.95.18.10596. Proc Natl Acad Sci U S A. 1998. PMID: 9724749 Free PMC article. - Identification of trichoplein, a novel keratin filament-binding protein.
Nishizawa M, Izawa I, Inoko A, Hayashi Y, Nagata K, Yokoyama T, Usukura J, Inagaki M. Nishizawa M, et al. J Cell Sci. 2005 Mar 1;118(Pt 5):1081-90. doi: 10.1242/jcs.01667. J Cell Sci. 2005. PMID: 15731013 - Protein interactions of FAM134B with EB1 and APC/beta-catenin in vitro in colon carcinoma.
Islam F, Chaousis S, Wahab R, Gopalan V, Lam AK. Islam F, et al. Mol Carcinog. 2018 Nov;57(11):1480-1491. doi: 10.1002/mc.22871. Epub 2018 Jul 18. Mol Carcinog. 2018. PMID: 29964340 - Adenomatous polyposis coli (Apc) tumor suppressor gene as a multifunctional gene.
Senda T, Shimomura A, Iizuka-Kogo A. Senda T, et al. Anat Sci Int. 2005 Sep;80(3):121-31. doi: 10.1111/j.1447-073x.2005.00106.x. Anat Sci Int. 2005. PMID: 16158975 Review. - [Familial adenomatous polyposis syndrome (FAP): pathogenesis and molecular mechanisms].
Friedrich A, Kullmann F. Friedrich A, et al. Med Klin (Munich). 2003 Dec 15;98(12):776-82. doi: 10.1007/s00063-003-1325-2. Med Klin (Munich). 2003. PMID: 14685680 Review. German.
Cited by
- APC/β-catenin-rich complexes at membrane protrusions regulate mammary tumor cell migration and mesenchymal morphology.
Odenwald MA, Prosperi JR, Goss KH. Odenwald MA, et al. BMC Cancer. 2013 Jan 9;13:12. doi: 10.1186/1471-2407-13-12. BMC Cancer. 2013. PMID: 23302090 Free PMC article. - The APC tumor suppressor is required for epithelial cell polarization and three-dimensional morphogenesis.
Lesko AC, Goss KH, Yang FF, Schwertner A, Hulur I, Onel K, Prosperi JR. Lesko AC, et al. Biochim Biophys Acta. 2015 Mar;1853(3):711-23. doi: 10.1016/j.bbamcr.2014.12.036. Epub 2015 Jan 8. Biochim Biophys Acta. 2015. PMID: 25578398 Free PMC article. - Oncogenic Serine 45-Deleted β-Catenin Remains Susceptible to Wnt Stimulation and APC Regulation in Human Colonocytes.
Parker TW, Rudeen AJ, Neufeld KL. Parker TW, et al. Cancers (Basel). 2020 Jul 30;12(8):2114. doi: 10.3390/cancers12082114. Cancers (Basel). 2020. PMID: 32751567 Free PMC article. - Adenomatous Polyposis Coli (APC) in cell migration.
Fang X, Svitkina TM. Fang X, et al. Eur J Cell Biol. 2022 Jun-Aug;101(3):151228. doi: 10.1016/j.ejcb.2022.151228. Epub 2022 Apr 22. Eur J Cell Biol. 2022. PMID: 35483122 Free PMC article. Review.
References
- Rubinfeld B, Souza B, Albert I, Muller O, Chamberlain SH, Masiarz FR, Munemitsu S, Polakis P. Association of the APC gene product with beta-catenin. Science. 1993;262:1731–1734. - PubMed
- Moseley JB, Bartolini F, Okada K, Wen Y, Gundersen GG, Goode BL. Regulated binding of adenomatous polyposis coli protein to actin. J Biol Chem. 2007;282:12661–12668. - PubMed
Publication types
MeSH terms
Substances
Grants and funding
- 5U01 CA084239-10/CA/NCI NIH HHS/United States
- R01 CA109220-05/CA/NCI NIH HHS/United States
- R01 CA109220-03/CA/NCI NIH HHS/United States
- P50 CA095103/CA/NCI NIH HHS/United States
- R01 CA046413/CA/NCI NIH HHS/United States
- R01 CA109220-01/CA/NCI NIH HHS/United States
- P50 CA095103-05/CA/NCI NIH HHS/United States
- R01 CA109220-02/CA/NCI NIH HHS/United States
- R01 CA046413-21/CA/NCI NIH HHS/United States
- R01 CA46413/CA/NCI NIH HHS/United States
- R01 CA109220/CA/NCI NIH HHS/United States
- R01 CA109220-04/CA/NCI NIH HHS/United States
- U01 CA084239/CA/NCI NIH HHS/United States
- CA95103/CA/NCI NIH HHS/United States
- R01 CA046413-22/CA/NCI NIH HHS/United States
LinkOut - more resources
Full Text Sources
Research Materials
Miscellaneous
