The requirement for cellular transportin 3 (TNPO3 or TRN-SR2) during infection maps to human immunodeficiency virus type 1 capsid and not integrase - PubMed (original) (raw)
The requirement for cellular transportin 3 (TNPO3 or TRN-SR2) during infection maps to human immunodeficiency virus type 1 capsid and not integrase
Lavanya Krishnan et al. J Virol. 2010 Jan.
Abstract
Recent genome-wide screens have highlighted an important role for transportin 3 in human immunodeficiency virus type 1 (HIV-1) infection and preintegration complex (PIC) nuclear import. Moreover, HIV-1 integrase interacted with recombinant transportin 3 protein under conditions whereby Moloney murine leukemia virus (MLV) integrase failed to do so, suggesting that integrase-transportin 3 interactions might underscore active retroviral PIC nuclear import. Here we correlate infectivity defects in transportin 3 knockdown cells with in vitro protein binding affinities for an expanded set of retroviruses that include simian immunodeficiency virus (SIV), bovine immunodeficiency virus (BIV), equine infectious anemia virus (EIAV), feline immunodeficiency virus (FIV), and Rous sarcoma virus (RSV) to critically address the role of integrase-transportin 3 interactions in viral infection. Lentiviruses, with the exception of FIV, display a requirement for transportin 3 in comparison to MLV and RSV, yielding an infection-based dependency ranking of SIV > HIV-1 > BIV and EIAV > MLV, RSV, and FIV. In vitro pulldown and surface plasmon resonance assays, in contrast, define a notably different integrase-transportin 3 binding hierarchy: FIV, HIV-1, and BIV > SIV and MLV > EIAV. Our results therefore fail to support a critical role for integrase binding in dictating transportin 3 dependency during retrovirus infection. In addition to integrase, capsid has been highlighted as a retroviral nuclear import determinant. Accordingly, MLV/HIV-1 chimera viruses pinpoint the genetic determinant of sensitization to transportin 3 knockdown to the HIV-1 capsid protein. We therefore conclude that capsid, not integrase, is the dominant viral factor that dictates transportin 3 dependency during HIV-1 infection.
Figures
FIG. 1.
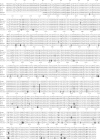
Amino acid sequence alignment of TNPO3 orthologs from Homo sapiens, rhesus macaque (Macaca mulatta), domestic cat (Felis catus), mouse (Mus musculus), cow (Bos taurus), horse (Equus caballus), and chicken (Gallus gallus) reveals the indicated nonhuman amino acid positions replaced by conserved (light gray) or nonhomologous (dark gray) residues as defined by previously reported chemical groupings (43). Numbers mark human sequence positions.
FIG. 2.
Retroviral infectivity profiles of TNPO3 knockdown cells. (A) Diluted lysate of empty vector control cells (from neat to 1:20) were loaded into lanes 1 to 6 to define a TNPO3 standard curve. Scanning densitometry revealed approximate 7- to 10-fold protein reductions in shRNA-expressing cells (lane 7); β-actin served as a gel loading control. (B) Results of five independent experiments (means ± standard errors of the means [SEM]) expressed as percent control-cell infection. (C) Western blots of mock-transfected HeLa-T4 cells (lane 1) or cells transfected with mismatched control (lanes 2 to 7) or TNPO3-targeting (lane 8) siRNA. (D) Infectivities (means ± SEM) (n = 4 experiments) of indicated retroviral vectors, expressed as percent infectivity in TNPO3 knockdown cells compared to mismatch siRNA-transfected controls. Results in A and C are representative data from duplicate Western blot experiments. Statistical significance values shown in B and D were calculated by using a Student's two-sided t test. Asterisks directly above bars indicate differences between knockdown and control cells for a given virus, whereas asterisks above lines indicate differences between indicated viruses. ***, P < 0.0001; **, P < 0.001; *, P < 0.01.
FIG. 3.
Pulldown analyses of IN-TNPO3 binding. (A) GST pulldowns. Lanes 1 to 5 contained 10% of input IN protein. Proteins bound to GST-TNPO3 (lanes 6 to 11)- and GST (lanes 12 to 17)-conjugated beads were released by boiling; gels were developed by Coomassie blue staining. IN was omitted from the reaction mixtures loaded into lanes 6 and 12. (B) Mock (lanes 1 to 5 and 13 to 17) or TNPO3-containing (lanes 7 to 12 and 19 to 24) Ni-NTA pulldowns were conducted with the indicated bead-bound INs. Eluted proteins were detected by Western blotting (top) or Coomassie blue staining (bottom). Input levels of TNPO3 were analyzed in lanes 6 and 18; IN was omitted from the reaction mixtures loaded into lanes 12 and 24. (C) Same as B except that LEDGFp75 was tested in place of TNPO3 and all proteins were detected with Coomassie blue. RSV IN and, to a lesser extent, MPMV displayed nonspecific binding to BSA (B, lanes 16, 17, 22, and 23, and C, lanes 15, 16, 20, and 21), which was included at 10 μg in all pulldown assays. The lack of RSV IN-LEDGFp75 binding (C, lane 20) indicated a specific RSV IN-TNPO3 interaction (B, lane 22). Migration positions of molecular mass standards in kDa are marked adjacent to gel panels.
FIG. 4.
SPR analysis of IN-TNPO3 interactions. Sensograms revealing association and dissociation binding phases were generated by using the following IN concentration ranges: 156.25 nM to 1.25 μM for HIV-1, 444.4 nM to 3.5 μM for MLV, 78.13 nM to 1.25 μM for SIV, 312.5 nM to 5 μM for EIAV, 78.13 nM to 625 nM for FIV, and 312.5 nM to 2.5 μM for BIV. RSV IN behaved as a relatively sticky analyte in this format and was therefore omitted from the SPR analysis.
FIG. 5.
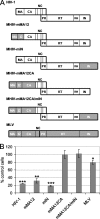
Infectivity profiles of MHIV chimera viruses versus HIV-1 and MLV. (A) Schematics of HIV-1 (white), MLV (gray), and chimera viral Gag and Pol proteins. NC, nucleocapsid; PR, protease; RT, reverse transcriptase; RH, RNase H. (B) Results of two independent experiments (means ± SEM) expressed as the percent infectivity on TNPO3-depleted compared to control cells. Student's two-sided t test comparisons of these values revealed significance parameters (***, P < 0.001; **, _P_ < 0.01; *, _P_ < 0.05). In contrast, relative MHIV-mMA12 and MHIV-mIN titers did not significantly differ (_P_ > 0.05) from the HIV-1 value.
Similar articles
- Interplay between HIV entry and transportin-SR2 dependency.
Thys W, De Houwer S, Demeulemeester J, Taltynov O, Vancraenenbroeck R, Gérard M, De Rijck J, Gijsbers R, Christ F, Debyser Z. Thys W, et al. Retrovirology. 2011 Jan 30;8:7. doi: 10.1186/1742-4690-8-7. Retrovirology. 2011. PMID: 21276267 Free PMC article. - The cargo-binding domain of transportin 3 is required for lentivirus nuclear import.
Logue EC, Taylor KT, Goff PH, Landau NR. Logue EC, et al. J Virol. 2011 Dec;85(24):12950-61. doi: 10.1128/JVI.05384-11. Epub 2011 Oct 5. J Virol. 2011. PMID: 21976643 Free PMC article. - Transportin 3 and importin α are required for effective nuclear import of HIV-1 integrase in virus-infected cells.
Levin A, Hayouka Z, Friedler A, Loyter A. Levin A, et al. Nucleus. 2010 Sep-Oct;1(5):422-31. doi: 10.4161/nucl.1.5.12903. Nucleus. 2010. PMID: 21326825 Free PMC article. - Role of Transportin-SR2 in HIV-1 Nuclear Import.
Tabasi M, Nombela I, Janssens J, Lahousse AP, Christ F, Debyser Z. Tabasi M, et al. Viruses. 2021 May 4;13(5):829. doi: 10.3390/v13050829. Viruses. 2021. PMID: 34064404 Free PMC article. Review. - On the cell biology of HIV integration from basic research to development of novel antiviral drugs.
Debyser Z, Christ F. Debyser Z, et al. Verh K Acad Geneeskd Belg. 2010;72(5-6):219-37. Verh K Acad Geneeskd Belg. 2010. PMID: 21409951 Review.
Cited by
- CPSF6-Dependent Targeting of Speckle-Associated Domains Distinguishes Primate from Nonprimate Lentiviral Integration.
Li W, Singh PK, Sowd GA, Bedwell GJ, Jang S, Achuthan V, Oleru AV, Wong D, Fadel HJ, Lee K, KewalRamani VN, Poeschla EM, Herschhorn A, Engelman AN. Li W, et al. mBio. 2020 Sep 29;11(5):e02254-20. doi: 10.1128/mBio.02254-20. mBio. 2020. PMID: 32994325 Free PMC article. - HIV-1 capsid undergoes coupled binding and isomerization by the nuclear pore protein NUP358.
Bichel K, Price AJ, Schaller T, Towers GJ, Freund SM, James LC. Bichel K, et al. Retrovirology. 2013 Jul 31;10:81. doi: 10.1186/1742-4690-10-81. Retrovirology. 2013. PMID: 23902822 Free PMC article. - HIV-1 uncoating: connection to nuclear entry and regulation by host proteins.
Ambrose Z, Aiken C. Ambrose Z, et al. Virology. 2014 Apr;454-455:371-9. doi: 10.1016/j.virol.2014.02.004. Epub 2014 Feb 20. Virology. 2014. PMID: 24559861 Free PMC article. Review. - N-terminally truncated POM121C inhibits HIV-1 replication.
Saito H, Takeuchi H, Masuda T, Noda T, Yamaoka S. Saito H, et al. PLoS One. 2017 Sep 5;12(9):e0182434. doi: 10.1371/journal.pone.0182434. eCollection 2017. PLoS One. 2017. PMID: 28873410 Free PMC article. - The ability of TNPO3-depleted cells to inhibit HIV-1 infection requires CPSF6.
Fricke T, Valle-Casuso JC, White TE, Brandariz-Nuñez A, Bosche WJ, Reszka N, Gorelick R, Diaz-Griffero F. Fricke T, et al. Retrovirology. 2013 Apr 26;10:46. doi: 10.1186/1742-4690-10-46. Retrovirology. 2013. PMID: 23622145 Free PMC article.
References
- Alexander, L., R. S. Veazey, S. Czajak, M. DeMaria, M. Rosenzweig, A. A. Lackner, R. C. Desrosiers, and V. G. Sasseville. 1999. Recombinant simian immunodeficiency virus expressing green fluorescent protein identifies infected cells in rhesus monkeys. AIDS Res. Hum. Retroviruses 15:11-21. - PubMed
- Ao, Z., G. Huang, H. Yao, Z. Xu, M. Labine, A. W. Cochrane, and X. Yao. 2007. Interaction of human immunodeficiency virus type 1 integrase with cellular nuclear import receptor importin 7 and its impact on viral replication. J. Biol. Chem. 282:13456-13467. - PubMed
- Bowerman, B., P. O. Brown, J. M. Bishop, and H. E. Varmus. 1989. A nucleoprotein complex mediates the integration of retroviral DNA. Genes Dev. 3:469-478. - PubMed
- Brass, A. L., D. M. Dykxhoorn, Y. Benita, N. Yan, A. Engelman, R. J. Xavier, J. Lieberman, and S. J. Elledge. 2008. Identification of host proteins required for HIV infection through a functional genomic screen. Science 319:921-926. - PubMed
Publication types
MeSH terms
Substances
LinkOut - more resources
Full Text Sources
Medical
Research Materials


