Polycystin-1 interacts with inositol 1,4,5-trisphosphate receptor to modulate intracellular Ca2+ signaling with implications for polycystic kidney disease - PubMed (original) (raw)
Polycystin-1 interacts with inositol 1,4,5-trisphosphate receptor to modulate intracellular Ca2+ signaling with implications for polycystic kidney disease
Yun Li et al. J Biol Chem. 2009.
Abstract
The PKD1 or PKD2 genes encode polycystins (PC) 1 and 2, which are associated with polycystic kidney disease. Previously we demonstrated that PC2 interacts with the inositol 1,4,5-trisphosphate receptor (IP(3)R) to modulate Ca(2+) signaling. Here, we investigate whether PC1 also regulates IP(3)R. We generated a fragment encoding the last six transmembrane (TM) domains of PC1 and the C-terminal tail (QIF38), a section with the highest homology to PC2. Using a Xenopus oocyte Ca(2+) imaging system, we observed that expression of QIF38 significantly reduced the initial amplitude of IP(3)-induced Ca(2+) transients, whereas a mutation lacking the C-terminal tail did not. Thus, the C terminus is essential to QIF38 function. Co-immunoprecipitation assays demonstrated that through its C terminus, QIF38 associates with the IP(3)-binding domain of IP(3)R. A shorter PC1 fragment spanning only the last TM and the C-terminal tail also reduced IP(3)-induced Ca(2+) release, whereas another C-terminal fragment lacking any TM domain did not. Thus, only endoplasmic reticulum-localized PC1 can modulate IP(3)R. Finally, we show that in the polarized Madin-Darby canine kidney cells, heterologous expression of full-length PC1 resulted in a smaller IP(3)-induced Ca(2+) response. Overexpression of the IP(3)-binding domain of IP(3)R reversed the inhibitory effect of PC1, suggesting interaction of full-length PC1 (or its cleavage forms) with endogenous IP(3)R in Madin-Darby canine kidney cells. These results indicate that the behavior of full-length PC1 in mammalian cells is congruent with that of PC1 C-terminal fragments in the oocyte system. These data demonstrate that PC1 inhibits Ca(2+) release, perhaps opposing the effect of PC2, which facilitates Ca(2+) release through the IP(3)R.
Figures
FIGURE 1.
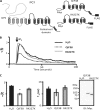
Overexpression of QIF38 significantly decreases the amplitude of Ca2+ transients induced by IP3. A, these panels graphically show full-length PC1, QIF38, and R4227X. The dark portion of PC1 is the region of homology with PC2. B, the traces represent change in fluorescence (Δ_F_/F) showing IP3-induced Ca2+ transients in control Xenopus oocytes injected with H2O (n = 44) and those overexpressing QIF38 (n = 39) or the C-terminal truncation mutant R4227X (n = 46). C, left panel, the histograms show the average of the amplitude of Ca2+ transients; the asterisk indicates statistical significance compared with the control (p < 0.00001, Student's t test). Middle panel, the histogram shows the averages of half decay times (_T_½) of the Ca2+ transients. Right panel, immunoblot (IB) shows the similar expression levels of QIF38 and R4227X in the oocytes.
FIGURE 2.
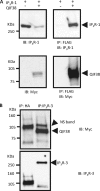
QIF38 physically associates with exogenously expressed type-1 IP3R, as well as the endogenously expressed type-3 IP3R. A, QIF38 physically associates with the exogenously expressed type-1 IP3R. HEK-293 cells were co-transfected with QIF38 and IP3R-1 or transfected with IP3R-1 alone as the negative control. Immunocomplexes were pulled down by FLAG antibody-conjugated beads. IP3R type-1 polyclonal antibody was used to probe the IP3R-1, and monoclonal Myc antibody was used to detect QIF38. Top panels, the immunoblotting (IB) was used to detect the IP3R-1 from the total cell lysates (left panel) and from the co-IP immunocomplex (right panel). Bottom panels, the immunoblot was used to detect QIF38 from the total cell lysates (left panel) and from the co-IP immunocomplex (right panel). B, QIF38 physically associates with endogenous type-3 IP3R. HEK-293 cells were transfected with QIF38 alone. Endogenous type-3 IP3R were pulled down by type-3 IP3R antibody. An unrelated HA antibody served as the negative control. Monoclonal Myc antibody was used to detect QIF38. Top panel, the immunoblot reveals QIF38 from the co-IP immunocomplex. Note that a nonspecific band (∼105 kDa indicated as “NS band”) above the QIF38 band was also pulled down in the co-IP immunocomplex, because it can be recognized by both monoclonal HA and IP3R-3 antibody. Bottom panel, the immunoblot reveals the endogenously expressed IP3R-3.
FIGURE 3.
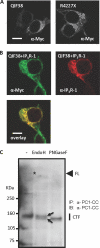
ER-localized PC1 fragments. A, an immunostaining of QIF38 and R4227X as detected with monoclonal Myc antibody (1:500). B, co-localization of QIF38 with IP3R. HEK-293 cells were co-transfected with QIF38 and IP3R-1. QIF38 was detected by monoclonal Myc antibody (1:250) and Alexa488 conjugated goat anti-mouse IgG (1:200). IP3R-1 was revealed by polyclonal anti-IP3R type-1 antibody (1:100) and Cy3-conjugated donkey anti-rabbit IgG (1:500). The scale bar represents 10 μm. C, Endo-H and PNGase F sensitivity assay with protein samples obtained from wild type murine embryonic fibroblasts. Endogenous PC1 was detected by a combination of immunoprecipitation and Western blot using PC1-CC antibody. The first lane of the blot represents control, untreated with neither Endo-H nor PNGase F. The asterisk on the blot shows the presence of full-length PC1 (marked FL) in the untreated control sample (first lane). Two black arrows point to the Endo-H resistant (upper) and -sensitive (lower) bands (second lane) of the C-terminal fragment of PC1 (CTF). IB, immunoblot.
FIGURE 4.
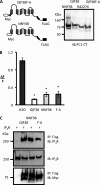
Overexpression of NNY38 or QIF38F-A mutation significantly decreases the amplitude of the Ca2+ transients induced by IP3. A, left panels graphically show portions of QIF38F-A and NNY38. The right panel is the immunoblot (IB) showing the expression of NNY38, QIF38, R4227X, and QIF38F-A in Xenopus oocytes as detected by PC1-CT antibody (1:1000). B, histograms show the averages of the amplitude of IP3-induced Ca2+ transients from oocytes injected with H2O (n = 35), oocytes overexpressing QIF38 (n = 20), NNY38 (n = 17), or QIF38F-A (n = 19). The bars represent the standard error, and the asterisk indicates statistical significance compared with the control (p < 0.001, Student's t test). C, NNY38 and F-A mutation physically associated with exogenous expressed type-1 IP3R. HEK-293 cells were transiently transfected with IP3R-1 alone or co-transfected with QIF38, NNY38, or QIF38F-A. FLAG antibody-conjugated beads were used to pull down the immunocomplexes. IP3R type-1 polyclonal antibody was used to probe the IP3R-1, and monoclonal Myc antibody was used to detect QIF38 or its various mutants. Top panel, the immunoblot was used to detect the IP3R-1 from the co-IP immunocomplexes. Middle panel, the immunoblot was used to detect the IP3R-1 from total cell lysates. Bottom panel, the immunoblot was used to detect QIF38, NNY38, and the F-A mutation from the co-IP immunocomplex.
FIGURE 5.
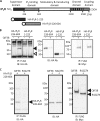
QIF38, but not C-terminal truncated R4227X, associates with the IP3-binding domain of IP3R. A, figure shows the putative structure of IP3R, its HA-tagged constructs of its suppressor domain (1–225), and its IP3-binding domain (amino acids 226–604). B, HEK-293 cells were transfected with HA-tagged IP3R domains alone or co-transfected together with QIF38. Immunocomplexes were pulled down by FLAG antibody (Ab)-conjugated beads. Monoclonal HA antibody was used to detect HA-tagged IP3R domains. Left panel, the immunoblot (IB) was used to probe HA-tagged IP3R domains from the co-IP immunocomplex. The black arrowhead indicates the ∼40-kDa IP3-binding domain (amino acids 226–604) from the co-IP. The white arrowhead indicates the absence of the band at ∼30 kDa, showing that QIF38 failed to pull down the suppressor domain (1–225). Middle panel, immunoblot of the total cell lysate detects the HA-tagged N-terminal domains of IP3R. Right panel, immunoblot of pulled down QIF38. C, HEK-293 cells co-transfected with HA-tagged IP3-binding domain (amino acids 226–604) with QIF38 or R4227X. Immunocomplexes were pulled down by FLAG antibody-conjugated beads. Monoclonal HA antibody was used to detect the HA-tagged IP3-binding domain. Left panel, immunoblot shows that the IP3-binding domain was co-immunoprecipitated with QIF38, but not with R4227X. Middle panel, immunoblot of total cell lysate detects the IP3-binding domain. Right panel, immunoblot of pulled down QIF38 and R4227X.
FIGURE 6.
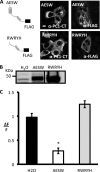
Expression of PC1 C-terminal tail significantly decreases the amplitude of Ca2+ transients induced by IP3. A, on the left are the C-terminal FLAG-tagged constructs AESW and RWRYH. On the right are subcellular localizations of AESW and RWRYH as revealed by immunostaining and detected with polyclonal FLAG antibody or PC1-CT and Cy3-conjugated donkey anti-rabbit IgG. The bar indicates 10 μm. B, the Western blot shows oocyte expression of AESW and RWRYH as detected by PC1-CT antibody. C, expression of PC1 C-terminal tail AESW associates with the reduced amplitude of IP3-induced Ca2+ transients, whereas its cytosolic portion, RWRYH, does not. Histograms show the average of the amplitude of Ca2+ transients, and an asterisk indicates statistical significance (p < 0.0001, Student's t test).
FIGURE 7.
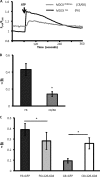
Full-length PC1 expression in polarized MDCK cells is associated with a reduced Ca2+ transient in response to 100 μm ATP stimulation, which can be rescued by overexpression of its binding partner, IP3R 226–604 fragment. A, full-length PC1 stably transfected MDCK cells displayed a reduced ATP-induced Ca2+ transient. The traces represent Ca2+ transients in response to ATP stimulation in the control MDCKzeo (F6, n = 9) and PC1-stable MDCKPKD1Zeo (C8/68, n = 13). B, histograms show the averages of the initial amplitude of Ca2+ transients. An asterisk indicates statistical significance (p < 0.0001, Student's t test). C, overexpression of the IP3R 226–604 fragment in PC1-expressing MDCK cells significantly increased Ca2+ release in response to 100 μ
m
ATP. The histogram shows the averages of initial amplitude of Ca2+ transient in response to ATP in four groups: control MDCK cells (MDCKzeo, F6) transfected with either GFP (F6+GFP, n = 9) or IP3R 226–604 (F6+226–604, n = 8), and PC1-expressing MDCK cells (MDCKPKD1Zeo, C8/68) transfected with either GFP (C8+GFP, n = 7) or IP3R 226–604 fragment (C8+226–604, n = 6). An asterisk indicates a statistical significance (p < 0.05 between the first two groups and p < 0.005 between the last two groups by Student's t test, respectively).
Similar articles
- Polycystin 2 interacts with type I inositol 1,4,5-trisphosphate receptor to modulate intracellular Ca2+ signaling.
Li Y, Wright JM, Qian F, Germino GG, Guggino WB. Li Y, et al. J Biol Chem. 2005 Dec 16;280(50):41298-306. doi: 10.1074/jbc.M510082200. Epub 2005 Oct 13. J Biol Chem. 2005. PMID: 16223735 - Polycystin-1, 2, and STIM1 interact with IP(3)R to modulate ER Ca release through the PI3K/Akt pathway.
Santoso NG, Cebotaru L, Guggino WB. Santoso NG, et al. Cell Physiol Biochem. 2011;27(6):715-26. doi: 10.1159/000330080. Epub 2011 Jun 17. Cell Physiol Biochem. 2011. PMID: 21691089 Free PMC article. - Polycystin-1 and polycystin-2 are both required to amplify inositol-trisphosphate-induced Ca2+ release.
Mekahli D, Sammels E, Luyten T, Welkenhuyzen K, van den Heuvel LP, Levtchenko EN, Gijsbers R, Bultynck G, Parys JB, De Smedt H, Missiaen L. Mekahli D, et al. Cell Calcium. 2012 Jun;51(6):452-8. doi: 10.1016/j.ceca.2012.03.002. Epub 2012 Mar 27. Cell Calcium. 2012. PMID: 22456092 - Polycystin-1: function as a mechanosensor.
Dalagiorgou G, Basdra EK, Papavassiliou AG. Dalagiorgou G, et al. Int J Biochem Cell Biol. 2010 Oct;42(10):1610-3. doi: 10.1016/j.biocel.2010.06.017. Epub 2010 Jun 25. Int J Biochem Cell Biol. 2010. PMID: 20601082 Review. - Calcium signaling and polycystin-2.
Anyatonwu GI, Ehrlich BE. Anyatonwu GI, et al. Biochem Biophys Res Commun. 2004 Oct 1;322(4):1364-73. doi: 10.1016/j.bbrc.2004.08.043. Biochem Biophys Res Commun. 2004. PMID: 15336985 Review.
Cited by
- Vasopressin and disruption of calcium signalling in polycystic kidney disease.
Chebib FT, Sussman CR, Wang X, Harris PC, Torres VE. Chebib FT, et al. Nat Rev Nephrol. 2015 Aug;11(8):451-64. doi: 10.1038/nrneph.2015.39. Epub 2015 Apr 14. Nat Rev Nephrol. 2015. PMID: 25870007 Free PMC article. Review. - Calcium-mediated mechanisms of cystic expansion.
Abdul-Majeed S, Nauli SM. Abdul-Majeed S, et al. Biochim Biophys Acta. 2011 Oct;1812(10):1281-90. doi: 10.1016/j.bbadis.2010.09.016. Epub 2010 Oct 12. Biochim Biophys Acta. 2011. PMID: 20932898 Free PMC article. Review. - The Mitochondrial Ca2+ import complex is altered in ADPKD.
Yanda MK, Tomar V, Cole R, Guggino WB, Cebotaru L. Yanda MK, et al. Cell Calcium. 2022 Jan;101:102501. doi: 10.1016/j.ceca.2021.102501. Epub 2021 Nov 19. Cell Calcium. 2022. PMID: 34823104 Free PMC article. - Ryanodine Receptors in Autophagy: Implications for Neurodegenerative Diseases?
Vervliet T. Vervliet T. Front Cell Neurosci. 2018 Mar 27;12:89. doi: 10.3389/fncel.2018.00089. eCollection 2018. Front Cell Neurosci. 2018. PMID: 29636667 Free PMC article. Review. - Role of calcium in polycystic kidney disease: From signaling to pathology.
Mangolini A, de Stephanis L, Aguiari G. Mangolini A, et al. World J Nephrol. 2016 Jan 6;5(1):76-83. doi: 10.5527/wjn.v5.i1.76. World J Nephrol. 2016. PMID: 26788466 Free PMC article. Review.
References
- Chapman A. B. (2007) J. Am. Soc. Nephrol. 18, 1399–1407 - PubMed
- Torres V. E., Harris P. C., Pirson Y. (2007) Lancet 369, 1287–1301 - PubMed
- Sandford R., Sgotto B., Aparicio S., Brenner S., Vaudin M., Wilson R. K., Chissoe S., Pepin K., Bateman A., Chothia C., Hughes J., Harris P. (1997) Hum. Mol. Genet. 6, 1483–1489 - PubMed
- Ikeda M., Guggino W. B. (2002) Curr. Opin. Nephrol. Hypertens. 11, 539–545 - PubMed
Publication types
MeSH terms
Substances
Grants and funding
- R01 DK032753/DK/NIDDK NIH HHS/United States
- R01 DK062199/DK/NIDDK NIH HHS/United States
- 5 R01 DK 32753/DK/NIDDK NIH HHS/United States
- DK 062199/DK/NIDDK NIH HHS/United States
LinkOut - more resources
Full Text Sources
Research Materials
Miscellaneous
