An epigenetic switch involving NF-kappaB, Lin28, Let-7 MicroRNA, and IL6 links inflammation to cell transformation - PubMed (original) (raw)
An epigenetic switch involving NF-kappaB, Lin28, Let-7 MicroRNA, and IL6 links inflammation to cell transformation
Dimitrios Iliopoulos et al. Cell. 2009.
Abstract
Inflammation is linked clinically and epidemiologically to cancer, and NF-kappaB appears to play a causative role, but the mechanisms are poorly understood. We show that transient activation of Src oncoprotein can mediate an epigenetic switch from immortalized breast cells to a stably transformed line that forms self-renewing mammospheres that contain cancer stem cells. Src activation triggers an inflammatory response mediated by NF-kappaB that directly activates Lin28 transcription and rapidly reduces let-7 microRNA levels. Let-7 directly inhibits IL6 expression, resulting in higher levels of IL6 than achieved by NF-kappaB activation. IL6-mediated activation of the STAT3 transcription factor is necessary for transformation, and IL6 activates NF-kappaB, thereby completing a positive feedback loop. This regulatory circuit operates in other cancer cells lines, and its transcriptional signature is found in human cancer tissues. Thus, inflammation activates a positive feedback loop that maintains the epigenetic transformed state for many generations in the absence of the inducing signal.
Figures
Figure 1
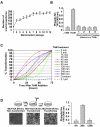
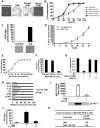
Epigenetic switch from untransformed to a transformed phenotype (A) Number of mammosphere formed/1000 seeded transformed (TAM-treated for 36h; mean ± SD) ER-Src cells during 12 serial passages. (B) Levels of Src-Y419 phosphorylation (ELISA assay; mean ± SD) in untreated, and TAM-treated (36h), and 1st, 2nd, 4th, and 8th generation mammospheres derived from TAM-treated ER-Src cells. (C) Kinetics of cellular transformation as a function of TAM exposure. ER-Src cells were treated with 1 μM TAM for the indicated times, and then analyzed for cellular transformation (defined by morphological changes) 24, 48 and 72h post TAM treatment. (D) Phase-contrast images and Src-Y419 phosphorylation levels (ELISA assay; mean ± SD) in ER-Src cells 36 and 120h post TAM treatment. Cells were treated with TAM for 36h and then TAM was removed from the medium.
Figure 2
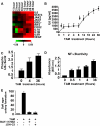
Src induces an inflammatory response mediated by NF-κB (A) Heatmap representation of RNA levels for the indicted inflammatory genes at the indicated time points after TAM induction. (B) IL6 levels (ELISA assay; mean ± SD)) at the indicated times after TAM treatment. The black arrows show the biphasic induction of IL6. (C) Phosphorylation status of IκBα-serine 32 (ELISA assay) in cells treated with TAM for the indicated times. (D) NF-κB/p65 ActivELISA assay (NF-κB nuclear localization) cells treated with TAM for the indicated times. (E) Soft agar colony assay (mean ± SD) in untreated and TAM-treated cells in the presence or absence of NF-κB inhibitors (5 μM BAY-117082 and 6 μM JSH-23).
Figure 3
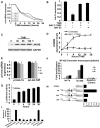
Let-7a is down-regulated during transformation by NF-κB. (A) RNA levels of individual let-7 family members in cells treated with TAM for the indicated times. (B) Levels of let-7a RNA in untreated and TAM-treated (36h) cells in the presence or absence of NF-κB inhibitor (5 μM BAY-117082 and 6 μM JSH-23). (C) Lin28B protein levels (western blot) in ER-Src cells at the indicated times after TAM treatment. (D) Lin28B mRNA levels (mean ± SD) during transformation in the presence or absence of an NF-κB inhibitor (5 μM BAY-117082). (E) Levels of precursor RNAs (pri-let-7a and pri-let-7d/f) in untreated and TAM-treated cells. (F) NF-κB occupancy (fold-enrichment) at the Lin-28B and let-7a loci as determined by chromatin immunoprecipitation of crosslinked cells that were or were not treated with TAM. (G) Luciferase activity (mean ± SD)) of Lin28B vector containing the NF-κB binding site during transformation. (H) Luciferase activity of Lin28B vector (wt, mutated or deleted in NF-κB site) in TAM-treated (36h) cells. (I) Anchorage-independent growth assays (microscopic counting of 50 μm colonies) of untreated and TAM-treated cells transfected with the indicated let-7 family members or siRNA against Lin28B.
Figure 4
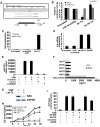
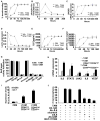
Let-7a regulates IL6 expression during transformation (A) Let-7a binding site in 3′UTR of IL6 with sequence complementarity and phylogenic conservation (yellow) of IL6 target sequence indicated. (B) Luciferase assay using a reporter containing the 3′UTR of IL6 (wt or mutant in let-7a binding site) 24h after transfection with let-7a or a scrambled miR control. (C) Physical interaction between let-7a and IL6 mRNA in the context of the RISC complex. IL6 RNA levels in HA-Ago1 immunoprecipitates in HEK-293 cells co-transfected with a plasmid expressing HA-Ago1 and let-7a or scrambled microRNA control. (D) IL6 RNA levels after treatment for 24h with antisense-let-7a (100 nM) or Lin28B. (E) Phosphorylation of STAT3-Y705 ELISA assay; mean ± SD) in untreated and TAM-treated (36h) cells in addition to treatment with increasing concentrations (50, 80, 100 nM) of let-7a and siRNA against Lin28B (80 nM). (F) VEGF and IL6 production (ELISA assay; mean ± SD) in TAM-treated cells before and after transfection (100 nM) of the indicated let-7 microRNAs. (G) Western blot analysis of RAS protein expression in 36h TAM-treated cells after let-7a (100 nM) overexpression; GAPDH levels were used as a loading control. (H) IL6 production (ELISA assay during transformation after transfection with negative control siRNA or siRNA against Ras or let-7a (100 nM). (I) Soft agar colony assay in TAM-treated cells after treatment with 2 μg/ml of monoclonal antibody against IL6 (Ab-IL6) and IgG isotype antibody (Ab-IgG) or siRNA negative control and siRNA against Ras (100 nM).
Figure 5
IL6 signaling pathway regulates MCF10A ER-Src transformation (A) Representative phase contrast images of ER-Src cells that were or were not treated with TAM and an antibody against IL6 (2 μg/ml). (B) Kinetics of cellular transformation (mean ± SD) in untreated and TAM-treated (5 minutes) cells together with 0.5 and 2 ug/ml of a monoclonal antibody against IL6 (Ab-IL6) or an isotype (Ab-IgG). (C) Soft agar colony assay in untreated and IL6-treated (1h) MCF10A cells. (D) Tumor growth of MCF10A and IL6-treated (1h) MCF10A cells in nude mice (5 mice/group). All the mice in the IL6-treated group developed tumors. (E) Kinetics of cellular transformation in IL6-treated (1h) MCF10A cells. (F) Soft agar colony assay in IL6-transformed MCF10A cells after treatment with 2ug/ml Ab-IL6 or Ab-IgG (control). (G) Let-7a expression in untreated and IL6-transformed MCF10A cells in the presence or absence of NF-κB inhibitors (5 μM BAY-117082 and 6 μM JSH-23). (H) RNA levels for the indicated genes in cells treated with TAM or an IL6 antibody. (I) Levels of phosphorylated STAT3 (pStat3; ELISA assay and western blot) in cells that were or were not treated with TAM and an antibody against IL6 2 (_ν_g/ml Ab-IL6). (J) Colony formation assay of untreated and TAM-treated cells in the presence of absence of an siRNA against Stat3 (80nM). (K) Tumor incidence of subcutaneously injected MCF10A ER-Src cells treated for 24h with Stat3 inhibitor (7uM JSI-124). The number of palpable tumors at 4 weeks is shown.
Figure 6
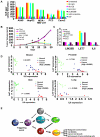
The positive feedback regulatory circuit is required for maintenance of the transformed phenotype and cancer stem cell population. (A) Kinetics of cellular transformation in TAM-treated (5 minutes and 36h) cells. (B) Levels of Src phosphorylation (ELISA assay), (C) Lin28B mRNA (real-time PCR), (D) let-7a (real-time PCR), (E) IL6 protein (ELISA assay) and (F) Stat3 phosphorylation (ELISA assay) in TAM-treated (5 minutes and 36h) cells (G) Colony formation assay in ER-Src cells (15 days post TAM treatment) treated with 2 μg/ml monoclonal antibody against IL6 (Ab-IL6), 80 nM siRNA against Lin28B, STAT3 inhibitor (7 μM JSI-124) and 80 nM siRNA against NF-κB (p65). Treatments with 2 μg/ml isotype antibody (Ab-IgG) and 80 nM negative control siRNA were used as controls. (H) Expression levels of the indicated RNAs (mean ± SD) in untreated cells and sorted CD44high/CD24low and CD44low/CD24high TAM-treated cells. (I) Let-7a and Lin28B RNA levels (mean ± SD) in untreated and sorted CD44high/CD24low and CD44low/CD24high TAM-treated cells. (J) Number of mammospheres/1000 seeded cells formed by TAM-treated cells in the presence or absence of 2 μg/ml Ab-IgG or Ab-IL6; 100 nM negative control siRNA or siRNA against IL6; 4 μg/ml Ab-IL6R; 5 μM BAY-117082.
Figure 7
Positive inflammatory feedback loop in cancer cells, xenografts and cancer patients. (A) Colony formation assay in A549 (lung), HepG2 (hepatocellular), MDA-MB-231 (breast), PC3 (prostate) and Caco2 (colon) cancer cell lines treated with 2 μg/ml Ab-IgG (control), 2 μg/ml Ab-IL6, 80 nM siRNA control, 80 nM siRNA against Lin28B, 100 nM microRNA scrambled control and 100nM let-7 microRNA for 24h. (B) Tumor growth of ER-Src cells after i.p treatment (days 15, 20, 25) with siRNA negative control, siRNA against Lin28B, BAY-117082, Ab-IgG and Ab-IL6. (C) Expression levels of Lin28B, let-7 and IL6 from tumors derived from the experiment described above. (D) Lin28B, let-7a and IL6 expression in breast, prostate, hepatocellular and lung cancer and normal tissues. Each data point represents an individual sample, and a correlation coefficient (r) between let-7a and IL6 expression is shown. (E) Schematic overview of inflammatory positive feedback loop during cellular transformation.
Comment in
- Transformation locked in a loop.
Drost J, Agami R. Drost J, et al. Cell. 2009 Nov 13;139(4):654-6. doi: 10.1016/j.cell.2009.10.035. Cell. 2009. PMID: 19914159 - Targeting liver cancer: first steps toward a miRacle?
Schwabe RF, Wang TC. Schwabe RF, et al. Cancer Cell. 2011 Dec 13;20(6):698-9. doi: 10.1016/j.ccr.2011.11.021. Cancer Cell. 2011. PMID: 22172719 Free PMC article.
Similar articles
- A model for the epigenetic switch linking inflammation to cell transformation: deterministic and stochastic approaches.
Gérard C, Gonze D, Lemaigre F, Novák B. Gérard C, et al. PLoS Comput Biol. 2014 Jan 30;10(1):e1003455. doi: 10.1371/journal.pcbi.1003455. eCollection 2014 Jan. PLoS Comput Biol. 2014. PMID: 24499937 Free PMC article. - STAT3 activation of miR-21 and miR-181b-1 via PTEN and CYLD are part of the epigenetic switch linking inflammation to cancer.
Iliopoulos D, Jaeger SA, Hirsch HA, Bulyk ML, Struhl K. Iliopoulos D, et al. Mol Cell. 2010 Aug 27;39(4):493-506. doi: 10.1016/j.molcel.2010.07.023. Mol Cell. 2010. PMID: 20797623 Free PMC article. - The inflammatory/cancer-related IL-6/STAT3/NF-κB positive feedback loop includes AUF1 and maintains the active state of breast myofibroblasts.
Hendrayani SF, Al-Harbi B, Al-Ansari MM, Silva G, Aboussekhra A. Hendrayani SF, et al. Oncotarget. 2016 Jul 5;7(27):41974-41985. doi: 10.18632/oncotarget.9633. Oncotarget. 2016. PMID: 27248826 Free PMC article. - Multi-Level Regulatory Interactions between NF-κB and the Pluripotency Factor Lin28.
Mills WT 4th, Nassar NN, Ravindra D, Li X, Meffert MK. Mills WT 4th, et al. Cells. 2020 Dec 17;9(12):2710. doi: 10.3390/cells9122710. Cells. 2020. PMID: 33348917 Free PMC article. Review. - Regulation of the MIR155 host gene in physiological and pathological processes.
Elton TS, Selemon H, Elton SM, Parinandi NL. Elton TS, et al. Gene. 2013 Dec 10;532(1):1-12. doi: 10.1016/j.gene.2012.12.009. Epub 2012 Dec 14. Gene. 2013. PMID: 23246696 Review.
Cited by
- Elevation of Il6 is associated with disturbed let-7 biogenesis in a genetic model of depression.
Wei YB, Liu JJ, Villaescusa JC, Åberg E, Brené S, Wegener G, Mathé AA, Lavebratt C. Wei YB, et al. Transl Psychiatry. 2016 Aug 16;6(8):e869. doi: 10.1038/tp.2016.136. Transl Psychiatry. 2016. PMID: 27529677 Free PMC article. - Lin28A and Lin28B inhibit let-7 microRNA biogenesis by distinct mechanisms.
Piskounova E, Polytarchou C, Thornton JE, LaPierre RJ, Pothoulakis C, Hagan JP, Iliopoulos D, Gregory RI. Piskounova E, et al. Cell. 2011 Nov 23;147(5):1066-79. doi: 10.1016/j.cell.2011.10.039. Cell. 2011. PMID: 22118463 Free PMC article. - Immunopathologic processes in sympathetic ophthalmia as signified by microRNA profiling.
Kaneko Y, Wu GS, Saraswathy S, Vasconcelos-Santos DV, Rao NA. Kaneko Y, et al. Invest Ophthalmol Vis Sci. 2012 Jun 28;53(7):4197-204. doi: 10.1167/iovs.12-9465. Invest Ophthalmol Vis Sci. 2012. PMID: 22589448 Free PMC article. - The Warburg effect version 2.0: metabolic reprogramming of cancer stem cells.
Menendez JA, Joven J, Cufí S, Corominas-Faja B, Oliveras-Ferraros C, Cuyàs E, Martin-Castillo B, López-Bonet E, Alarcón T, Vazquez-Martin A. Menendez JA, et al. Cell Cycle. 2013 Apr 15;12(8):1166-79. doi: 10.4161/cc.24479. Epub 2013 Apr 2. Cell Cycle. 2013. PMID: 23549172 Free PMC article. - Anti-inflammatory Effects of Phyllanthus emblica L on Benzopyrene-Induced Precancerous Lung Lesion by Regulating the IL-1β/miR-101/Lin28B Signaling Pathway.
Wang CC, Yuan JR, Wang CF, Yang N, Chen J, Liu D, Song J, Feng L, Tan XB, Jia XB. Wang CC, et al. Integr Cancer Ther. 2017 Dec;16(4):505-515. doi: 10.1177/1534735416659358. Epub 2016 Aug 24. Integr Cancer Ther. 2017. PMID: 27562754 Free PMC article.
References
- Abu-Amer Y, Ross F, McHugh K, Livolsi A, Peyron JF, Teitelbaum S. Tumor necrosis factor-alpha activation on nuclear factor-kB in marrow macrophages is mediated by c-Src tryrosine phosphorylation of IKB. J Biol Chem. 1998;273:29417–29423. - PubMed
- Balkwill F, Mantovani A. Inflammation and cancer: back to Virchow? Lancet. 2001;357:539–545. - PubMed
- Baylin SB. DNA methylation and gene silencing in cancer. Nat Clin Pract Oncol. 2005;2:S4–11. - PubMed
Publication types
MeSH terms
Substances
LinkOut - more resources
Full Text Sources
Other Literature Sources
Molecular Biology Databases
Research Materials
Miscellaneous
