Eset partners with Oct4 to restrict extraembryonic trophoblast lineage potential in embryonic stem cells - PubMed (original) (raw)
Eset partners with Oct4 to restrict extraembryonic trophoblast lineage potential in embryonic stem cells
Ping Yuan et al. Genes Dev. 2009.
Abstract
The histone H3 Lys 9 (H3K9) methyltransferase Eset is an epigenetic regulator critical for the development of the inner cell mass (ICM). Although ICM-derived embryonic stem (ES) cells are normally unable to contribute to the trophectoderm (TE) in blastocysts, we find that depletion of Eset by shRNAs leads to differentiation with the formation of trophoblast-like cells and induction of trophoblast-associated gene expression. Using chromatin immmunoprecipitation (ChIP) and sequencing (ChIP-seq) analyses, we identified Eset target genes with Eset-dependent H3K9 trimethylation. We confirmed that genes that are preferentially expressed in the TE (Tcfap2a and Cdx2) are bound and repressed by Eset. Single-cell PCR analysis shows that the expression of Cdx2 and Tcfap2a is also induced in Eset-depleted morula cells. Importantly, Eset-depleted cells can incorporate into the TE of a blastocyst and, subsequently, placental tissues. Coimmunoprecipitation and ChIP assays further demonstrate that Eset interacts with Oct4, which in turn recruits Eset to silence these trophoblast-associated genes. Our results suggest that Eset restricts the extraembryonic trophoblast lineage potential of pluripotent cells and links an epigenetic regulator to key cell fate decision through a pluripotency factor.
Figures
Figure 1.
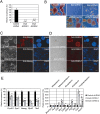
Eset is required for the maintenance of ES cells. (A) Depletion of Eset by RNAi. Level of Eset transcripts after knockdown was measured by real-time PCR analysis. Data are represented as mean ± SD; n = 3. (**) P < 0.005. (B) Eset knockdown leads to ES cell differentiation. The ES cells were transfected with plasmids expressing control Luc shRNA, Eset shRNA1, or Eset shRNA2. In control shRNA transfected cells, colony morphology typical for undifferentiated ES cells was maintained. Flattened fibroblast-like cells were formed after Eset depletion. The cells were selected with puromycin for 5 d before alkaline phosphatase assay was performed to detect undifferentiated ES cells. Cotransfection of RNAi-immune Eset rescued the differentiation phenotype induced by the Eset shRNAs. Bar, 100 μm. (C,D) Immunofluorescence staining with Nanog or SSEA-1 antibody. Bar, 100 μm. (E) Real-time PCR analysis of ES cell-associated gene expression (left panel) and lineage-specific marker gene expression (right panel) in Eset and control knockdown cells. Data are represented as mean ± SD; n = 3. (*) P < 0.05; (**) P < 0.005.
Figure 2.
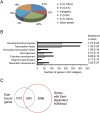
Genome-wide mapping of Eset in ES cells using ChIP-seq technology. (A) Distribution of Eset-binding sites. Locations of Eset-binding sites relative to the nearest Refseq genes. The percentages of binding sites at the respective locations are shown. (B) GO analysis of Eset-bound genes. Black bars represent the number of Eset-bound genes (observed) in the respective GO category. White bars represent the number of genes expected by chance. (C) Intersection of Eset-bound genes and genes that show Eset-dependent H3K9me3.
Figure 3.
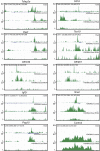
Eset and H3K9me3 profiles of genes. Eset and H3K9me3 profiles on the trophoblast lineage genes Tcfap2a and Cdh3, genes associated with germ cells Dazl and Tex19, olfactory receptor genes Olfr339 and Olfr901, and imprinted genes Igf2r, Nnat, and Peg10.
Figure 4.
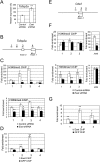
Eset regulates H3K9 methylation at Tcfap2a and Cdx2 loci. (A) Real-time PCR analysis of Tcfap2a expression after knockdown using Eset shRNA construct. Control shRNA targets luciferase sequence. The levels of the transcripts were normalized against control Luc shRNA. (B) Scheme of the amplicons (black bars labeled 1–4) used to analyze ChIP-enriched fragments over the Tcfap2a. (C) Eset regulates H3K9me3 and H3K9me2 levels of Tcfap2a. ChIP assays were performed using anti-H3K9me3 (top panel) or anti-H3K9me2 (bottom panel) antibodies with extracts prepared from Eset knockdown (black bars) and control knockdown (white bars) cells. (D) Eset binds to Tcfcp2a. ChIP assays were performed with Eset or control GFP antibodies, and DNA samples were measured by real-time PCR using primers targeting the amplicons shown in B. (E) Scheme of the amplicons (black bars labeled 1–3) used to analyze ChIP-enriched fragments over the Cdx2. (F) Eset regulates H3K9me2 level of Cdx2. ChIP assays were performed using anti-H3K9me3 (top panel) or anti-H3K9me2 (bottom panel) antibodies with extracts prepared from Eset knockdown (black bars) and control knockdown (white bars) cells. H3K9me3 at Cdx2 was not affected by Eset depletion, but H3K9me3 at H19 showed Eset-dependent H3K9me3. H3K9me2 level at Cdx2 was significantly reduced, but H3K9me2 level at the control H19 locus was not altered by Eset depletion. (G) Eset binds to Cdx2. ChIP assays were performed with Eset or GFP antibodies, and DNA samples were measured by real-time PCR using primers targeting the amplicons shown in E. All the data are represented as mean ± SD; n = 3. (*) P < 0.05; (**) P < 0.005.
Figure 5.
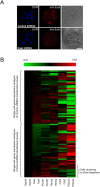
Eset depletion induces TE-specific transcription factor expression in morula cells. (A) Eset expression is reduced in the Eset shRNA transfected morula as compared with control shRNA transfected morula. Bar, 20 μm. (B) Expression of ICM and TE lineage-specific transcription factors in control shRNA- or Eset shRNA-tranduced morula cells by single-cell qRT–PCR analysis. The heat map displays the mean centered cycling threshold (Ct) values after being normalized with Gapdh. The expression of ICM-specific genes Nanog and Pou5f1 was reduced, but TE-specific genes Cdx2 and Tcfap2a were induced in the Eset shRNA-transduced morula cell as compared with the control. Red indicates increased expression compared with control, whereas green means decreased expression.
Figure 6.
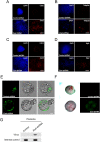
_Eset_-depleted cells incorporate into TE. Immunofluorescence staining of Eset and control knockdown cells with anti-Cdx2 (A), anti-Tcfap2a (B), anti-Cdh3 (C), and anti-Kip2 (D) antibodies. ES cells were transduced with lentivirus expressing shRNA (Eset shRNA or control Luc shRNA) and GFP. Three days post-infection, FACS was used to isolate GFP-positive cells. The cells were then cultured in TS cell medium for 5–9 d before immunostaining. The cells were also stained with DAPI to locate the nuclei. Bars, 100 μm. (E) Eset or control knockdown cells were injected into four- to eight-cell-stage embryos. The embryos were then allowed to develop into blastocysts and were visualized with fluorescence microscopy to detect GFP-positive cells. For Eset knockdown cells, 25 out of 25 blastocysts showed TE incorporation. However, only one out of 22 blastocysts showed TE incorporation for the control knockdown cells. Bars, 20 μm. (F) Chimeric placental tissues were obtained from the Eset shRNA knockdown ES cells, but not from the control shRNA knockdown ES cells. GFP fluorescence images of the placental tissues were captured by fluorescence microscopy. (G) Genotyping of the placental tissues shown in E.
Figure 7.
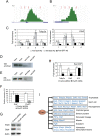
Oct4 recruits Eset to Tcfap2a and Cdx2. (A) Screen shots of the genome browser showing Oct4 ChIP-seq profiles at Tcfap2a locus. Red bars show the locations of amplicons used for ChIP-qPCR assay. (B) Screen shots of the genome browser showing Oct4 ChIP-seq profiles at the Cdx2 locus. Red bars show the locations of amplicons used for the ChIP-qPCR assay. (C) ChIP assays were performed using anti-Oct4, anti-Eset, or anti-GFP antibodies. Quantitative real-time PCR analyses of ChIP samples were carried out using primer pairs for Tcfap2a and Cdx2 loci. The locations of the amplicons are shown in A and B. Fold enrichment represents the abundance of enriched DNA fragments over a control region. GFP ChIP served as mock ChIP. Data are presented as the mean ± SD; n = 3. (*) P < 0.05; (**) P < 0.005. (D) Eset interacts with Oct4 in ES cells. Anti-Oct4 or anti-GFP antibodies were used for immunoprecipitation and associated proteins were analyzed by Western blotting using an anti-Eset antibody. (E) Reverse coimmunoprecipitation experiment showing that Oct4 is present in anti-Eset immunoprecipitation samples but not control anti-GFP immunoprecipitation samples. (F) Analysis of Eset and Pou5f1 transcripts after Pou5f1 knockdown. A construct expressing Pou5f1 shRNA was transfected into ES cells for 1 d, and cells were harvested for real-time PCR analysis of the transcripts. Data are represented as mean ± SD; n = 3. (**) P < 0.005. (G) Analysis of Eset and Oct4 after Pou5f1 knockdown. A construct expressing Pou5f1 shRNA was transfected into ES cells for 1 d and cells were harvested for Western blot analysis for Oct4, Eset, and Actin. (H) Eset occupancy at Tcfap2a, Cdx2, and H19 in Pou5f1 knockdown and control ES cells was analyzed by ChIP-qPCR. Data are represented as mean ± SD; n = 3. (**) P < 0.005. (I) A model to depict different classes of genes repressed by Eset.
Similar articles
- Evidence that transcription factor AP-2γ is not required for Oct4 repression in mouse blastocysts.
Choi I, Carey TS, Wilson CA, Knott JG. Choi I, et al. PLoS One. 2013 May 31;8(5):e65771. doi: 10.1371/journal.pone.0065771. Print 2013. PLoS One. 2013. PMID: 23741512 Free PMC article. - Transcriptional reprogramming and chromatin remodeling accompanies Oct4 and Nanog silencing in mouse trophoblast lineage.
Carey TS, Choi I, Wilson CA, Floer M, Knott JG. Carey TS, et al. Stem Cells Dev. 2014 Feb 1;23(3):219-29. doi: 10.1089/scd.2013.0328. Epub 2013 Nov 7. Stem Cells Dev. 2014. PMID: 24059348 Free PMC article. - The transcription factor TCFAP2C/AP-2gamma cooperates with CDX2 to maintain trophectoderm formation.
Kuckenberg P, Buhl S, Woynecki T, van Fürden B, Tolkunova E, Seiffe F, Moser M, Tomilin A, Winterhager E, Schorle H. Kuckenberg P, et al. Mol Cell Biol. 2010 Jul;30(13):3310-20. doi: 10.1128/MCB.01215-09. Epub 2010 Apr 19. Mol Cell Biol. 2010. PMID: 20404091 Free PMC article. - Breaking the first lineage barrier - many roads to trophoblast stem cell fate.
Kubaczka C, Kaiser F, Schorle H. Kubaczka C, et al. Placenta. 2017 Dec;60 Suppl 1:S52-S56. doi: 10.1016/j.placenta.2016.12.025. Epub 2016 Dec 23. Placenta. 2017. PMID: 28043657 Review. - Epigenetic control of cell fate in mouse blastocysts: the role of covalent histone modifications and chromatin remodeling.
Paul S, Knott JG. Paul S, et al. Mol Reprod Dev. 2014 Feb;81(2):171-82. doi: 10.1002/mrd.22219. Epub 2013 Aug 13. Mol Reprod Dev. 2014. PMID: 23893501 Free PMC article. Review.
Cited by
- Recruitment and biological consequences of histone modification of H3K27me3 and H3K9me3.
Kim J, Kim H. Kim J, et al. ILAR J. 2012;53(3-4):232-9. doi: 10.1093/ilar.53.3-4.232. ILAR J. 2012. PMID: 23744963 Free PMC article. - Follistatin treatment modifies DNA methylation of the CDX2 gene in bovine preimplantation embryos.
Ashry M, Rajput SK, Folger JK, Yang C, Knott JG, Smith GW. Ashry M, et al. Mol Reprod Dev. 2020 Sep;87(9):998-1008. doi: 10.1002/mrd.23409. Epub 2020 Aug 10. Mol Reprod Dev. 2020. PMID: 32776625 Free PMC article. - Embryonic stem cell and induced pluripotent stem cell: an epigenetic perspective.
Liang G, Zhang Y. Liang G, et al. Cell Res. 2013 Jan;23(1):49-69. doi: 10.1038/cr.2012.175. Epub 2012 Dec 18. Cell Res. 2013. PMID: 23247625 Free PMC article. Review. - Setdb1-mediated H3K9 methylation is enriched on the inactive X and plays a role in its epigenetic silencing.
Keniry A, Gearing LJ, Jansz N, Liu J, Holik AZ, Hickey PF, Kinkel SA, Moore DL, Breslin K, Chen K, Liu R, Phillips C, Pakusch M, Biben C, Sheridan JM, Kile BT, Carmichael C, Ritchie ME, Hilton DJ, Blewitt ME. Keniry A, et al. Epigenetics Chromatin. 2016 May 18;9:16. doi: 10.1186/s13072-016-0064-6. eCollection 2016. Epigenetics Chromatin. 2016. PMID: 27195021 Free PMC article. - Targets of histone H3 lysine 9 methyltransferases.
Levinsky AJ, McEdwards G, Sethna N, Currie MA. Levinsky AJ, et al. Front Cell Dev Biol. 2022 Dec 6;10:1026406. doi: 10.3389/fcell.2022.1026406. eCollection 2022. Front Cell Dev Biol. 2022. PMID: 36568972 Free PMC article. Review.
References
- Auman HJ, Nottoli T, Lakiza O, Winger Q, Donaldson S, Williams T. Transcription factor AP-2γ is essential in the extra-embryonic lineages for early postimplantation development. Development. 2002;129:2733–2747. - PubMed
- Ayyanathan K, Lechner MS, Bell P, Maul GG, Schultz DC, Yamada Y, Tanaka K, Torigoe K, Rauscher FJ., 3rd Regulated recruitment of HP1 to a euchromatic gene induces mitotically heritable, epigenetic gene silencing: A mammalian cell culture model of gene variegation. Genes & Dev. 2003;17:1855–1869. - PMC - PubMed
- Barski A, Cuddapah S, Cui K, Roh TY, Schones DE, Wang Z, Wei G, Chepelev I, Zhao K. High-resolution profiling of histone methylations in the human genome. Cell. 2007;129:823–837. - PubMed
- Beddington RS, Robertson EJ. An assessment of the developmental potential of embryonic stem cells in the midgestation mouse embryo. Development. 1989;105:733–737. - PubMed
Publication types
MeSH terms
Substances
LinkOut - more resources
Full Text Sources
Molecular Biology Databases
Research Materials
