Dimeric coiled-coil structure of Saccharomyces cerevisiae Atg16 and its functional significance in autophagy - PubMed (original) (raw)
Dimeric coiled-coil structure of Saccharomyces cerevisiae Atg16 and its functional significance in autophagy
Yuko Fujioka et al. J Biol Chem. 2010.
Abstract
Atg16 interacts with the Atg12-Atg5 protein conjugate through its N-terminal domain and self-assembles through its coiled-coil domain (CCD). Formation of the Atg12-Atg5.Atg16 complex is essential for autophagy, the bulk degradation process conserved among most eukaryotes. Here, we report the crystal structures of full-length Saccharomyces cerevisiae Atg16 at 2.8 A resolution and its CCD at 2.5 A resolution. The CCD and full-length Atg16 each exhibit an extended alpha-helix, 90 and 130 A, respectively, and form a parallel coiled-coil dimer in the crystals. Although the apparent molecular weight of Atg16 observed by gel-filtration chromatography suggests that Atg16 is tetrameric, an analytical ultracentrifugation study showed Atg16 as a dimer in solution, consistent with the crystal structure. Evolutionary conserved surface residues clustered at the C-terminal half of Atg16 CCD were shown to be crucial for autophagy. These results will give a structural basis for understanding the molecular functions and significance of Atg16 in autophagy.
Figures
FIGURE 1.
A, sequence alignment of Atg16 homologues. Secondary structure elements are shown below the alignment. Positions a and d in CCD are indicated above the alignment. The β-branched residues at positions a and d are enclosed in green squares. Hydrophobic, acidic, and basic residues conserved in 7 or more of the homologues are colored yellow, red, and blue, respectively. The number of inserted residues at the linker region is given as subscripts at the linker portion of the sequences. Mammalian Atg16L1 and XtAtg16 have the WD40 domain at the C terminus, which is omitted from the alignment. Hs, H. sapiens; Mm, Mus musculus; Xt, Xenopus tropicalis; Ag, Ashbya gossypii; Cg, Candida glabrata; Dh, Debaryomyces hansenii; En, Emericella nidulans; Kl, Kluyveromyces lactis; Mg, Magnaporthe grisea; and Sc, S. cerevisiae. B, helical wheel representation of Atg16 CCD. The view is from the N terminus. Heptad repeat positions are labeled a–g. Residues at positions a and d are colored red. β-branched amino acids are observed at position a but not at position d.
FIGURE 2.
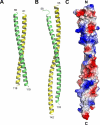
Overall structure of Atg16. A, ribbon diagram of Atg16CCD. B, ribbon diagram of Atg16F. C, electrostatic potential surface representation of Atg16F (blue, positive; red, negative). The models are all shown in the same orientation. All structural models in Figs. 2, 4, and 6 were prepared by PyMOL (35). N, N terminus; C, C terminus.
FIGURE 3.
Sedimentation equilibrium profiles for Atg16 and the Atg5·Atg16 complex. Samples at three different concentrations were centrifuged and equilibrated at three different speeds (see under “Experimental Procedures”). Global fitting of data at the 9 conditions yielded an apparent average molecular mass of 30,861 Da for Atg16 and 108,145 Da for the Atg5·Atg16 complex. Absorbance (280 nm) at a sedimentation equilibrium of 0.45 mg/ml Atg16 at 12,000 rpm (left) and at 0.13 mg/ml for the Atg5·Atg16 complex at 10,000 rpm (right) are shown as a function of the radial cell position from the axis of rotation (lower panel). Nonlinear least squares fits to a model assuming a single ideal species is overlaid onto these data sets (lower panel). Residuals for the nonlinear least square fits are plotted versus the distance from the axis of rotation (upper panel).
FIGURE 4.
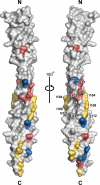
Conserved residues on the surface of Atg16CCD. Conserved hydrophobic, acidic, and basic residues that are not located at positions a and d are colored yellow, red, and blue, respectively. N, N terminus; C, C terminus.
FIGURE 5.
Conserved residues on the surface of Atg16CCD are required for autophagy. A, autophagic activity was estimated using an ALP assay (see under “Experimental Procedures”). White and gray bars indicate ALP activities at 0 and 4.5 h after starvation, respectively. B, shown is the monitoring of Ape1 maturation under growing (upper) or starvation (lower) conditions using a CEN plasmid pRS316 as an expression vector for Atg16. The lysates were separated by urea-SDS-PAGE and subjected to immunoblotting with anti-Ape1 antibody. C, shown are experiments using a 2-μm plasmid pRS426 as an expression vector (Vec.) for Atg16 (left, growing; right, starvation). Upper panels, expression level of Atg16 mutants. The lysates were separated by SDS-PAGE and subjected to immunoblotting with anti-Atg16 antibody. Lower panels, a monitoring Ape1 maturation is shown. The lysates were separated by urea-SDS-PAGE and subjected to immunoblotting with anti-Ape1 antibody. WT, wild-type.
FIGURE 6.
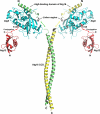
Proposed model of the Atg12-Atg5·Atg16 complex. The structures of the Atg5·Atg16(1–57) complex (Protein Data Bank code 2DYO) and plant Atg12b (Protein Data Bank code 1WZ3) drawn with the Atg16F structure. Atg5 and Atg12 are colored cyan and red, respectively. The two Atg16 molecules are colored green and yellow, with the linker regions colored black.
Similar articles
- The Role of ATG16 in Autophagy and The Ubiquitin Proteasome System.
Xiong Q, Li W, Li P, Yang M, Wu C, Eichinger L. Xiong Q, et al. Cells. 2018 Dec 20;8(1):2. doi: 10.3390/cells8010002. Cells. 2018. PMID: 30577509 Free PMC article. Review. - Membrane Binding and Homodimerization of Atg16 Via Two Distinct Protein Regions is Essential for Autophagy in Yeast.
Popelka H, Reinhart EF, Metur SP, Leary KA, Ragusa MJ, Klionsky DJ. Popelka H, et al. J Mol Biol. 2021 Mar 5;433(5):166809. doi: 10.1016/j.jmb.2021.166809. Epub 2021 Jan 21. J Mol Biol. 2021. PMID: 33484718 Free PMC article. - Crystallization of the coiled-coil domain of Atg16 essential for autophagy.
Fujioka Y, Noda NN, Matsushita M, Ohsumi Y, Inagaki F. Fujioka Y, et al. Acta Crystallogr Sect F Struct Biol Cryst Commun. 2008 Nov 1;64(Pt 11):1046-8. doi: 10.1107/S1744309108031898. Epub 2008 Oct 31. Acta Crystallogr Sect F Struct Biol Cryst Commun. 2008. PMID: 18997338 Free PMC article. - Structure of Atg5.Atg16, a complex essential for autophagy.
Matsushita M, Suzuki NN, Obara K, Fujioka Y, Ohsumi Y, Inagaki F. Matsushita M, et al. J Biol Chem. 2007 Mar 2;282(9):6763-72. doi: 10.1074/jbc.M609876200. Epub 2006 Dec 27. J Biol Chem. 2007. PMID: 17192262 - Expression, purification and crystallization of the Atg5-Atg16 complex essential for autophagy.
Matsushita M, Suzuki NN, Fujioka Y, Ohsumi Y, Inagaki F. Matsushita M, et al. Acta Crystallogr Sect F Struct Biol Cryst Commun. 2006 Oct 1;62(Pt 10):1021-3. doi: 10.1107/S1744309106036232. Epub 2006 Sep 30. Acta Crystallogr Sect F Struct Biol Cryst Commun. 2006. PMID: 17012802 Free PMC article.
Cited by
- Interaction between FIP200 and ATG16L1 distinguishes ULK1 complex-dependent and -independent autophagy.
Gammoh N, Florey O, Overholtzer M, Jiang X. Gammoh N, et al. Nat Struct Mol Biol. 2013 Feb;20(2):144-9. doi: 10.1038/nsmb.2475. Epub 2012 Dec 23. Nat Struct Mol Biol. 2013. PMID: 23262492 Free PMC article. - Defective Autophagy in T Cells Impairs the Development of Diet-Induced Hepatic Steatosis and Atherosclerosis.
Amersfoort J, Douna H, Schaftenaar FH, Foks AC, Kröner MJ, van Santbrink PJ, van Puijvelde GHM, Bot I, Kuiper J. Amersfoort J, et al. Front Immunol. 2018 Dec 12;9:2937. doi: 10.3389/fimmu.2018.02937. eCollection 2018. Front Immunol. 2018. PMID: 30619297 Free PMC article. - The Role of ATG16 in Autophagy and The Ubiquitin Proteasome System.
Xiong Q, Li W, Li P, Yang M, Wu C, Eichinger L. Xiong Q, et al. Cells. 2018 Dec 20;8(1):2. doi: 10.3390/cells8010002. Cells. 2018. PMID: 30577509 Free PMC article. Review. - Mechanisms governing autophagosome biogenesis.
Nakatogawa H. Nakatogawa H. Nat Rev Mol Cell Biol. 2020 Aug;21(8):439-458. doi: 10.1038/s41580-020-0241-0. Epub 2020 May 5. Nat Rev Mol Cell Biol. 2020. PMID: 32372019 Review. - Membrane Binding and Homodimerization of Atg16 Via Two Distinct Protein Regions is Essential for Autophagy in Yeast.
Popelka H, Reinhart EF, Metur SP, Leary KA, Ragusa MJ, Klionsky DJ. Popelka H, et al. J Mol Biol. 2021 Mar 5;433(5):166809. doi: 10.1016/j.jmb.2021.166809. Epub 2021 Jan 21. J Mol Biol. 2021. PMID: 33484718 Free PMC article.
References
- Seglen P. O., Bohley P. (1992) Experientia 48, 158–172 - PubMed
- Mizushima N. (2007) Genes Dev. 21, 2861–2873 - PubMed
- Nakatogawa H., Suzuki K., Kamada Y., Ohsumi Y. (2009) Nat. Rev. Mol. Cell Biol. 10, 458–467 - PubMed
- Ohsumi Y. (2001) Nat. Rev. Mol. Cell Biol. 2, 211–216 - PubMed
Publication types
MeSH terms
Substances
LinkOut - more resources
Full Text Sources
Molecular Biology Databases


