Intrinsic functional connectivity as a tool for human connectomics: theory, properties, and optimization - PubMed (original) (raw)
Intrinsic functional connectivity as a tool for human connectomics: theory, properties, and optimization
Koene R A Van Dijk et al. J Neurophysiol. 2010 Jan.
Abstract
Resting state functional connectivity MRI (fcMRI) is widely used to investigate brain networks that exhibit correlated fluctuations. While fcMRI does not provide direct measurement of anatomic connectivity, accumulating evidence suggests it is sufficiently constrained by anatomy to allow the architecture of distinct brain systems to be characterized. fcMRI is particularly useful for characterizing large-scale systems that span distributed areas (e.g., polysynaptic cortical pathways, cerebro-cerebellar circuits, cortical-thalamic circuits) and has complementary strengths when contrasted with the other major tool available for human connectomics-high angular resolution diffusion imaging (HARDI). We review what is known about fcMRI and then explore fcMRI data reliability, effects of preprocessing, analysis procedures, and effects of different acquisition parameters across six studies (n = 98) to provide recommendations for optimization. Run length (2-12 min), run structure (1 12-min run or 2 6-min runs), temporal resolution (2.5 or 5.0 s), spatial resolution (2 or 3 mm), and the task (fixation, eyes closed rest, eyes open rest, continuous word-classification) were varied. Results revealed moderate to high test-retest reliability. Run structure, temporal resolution, and spatial resolution minimally influenced fcMRI results while fixation and eyes open rest yielded stronger correlations as contrasted to other task conditions. Commonly used preprocessing steps involving regression of nuisance signals minimized nonspecific (noise) correlations including those associated with respiration. The most surprising finding was that estimates of correlation strengths stabilized with acquisition times as brief as 5 min. The brevity and robustness of fcMRI positions it as a powerful tool for large-scale explorations of genetic influences on brain architecture. We conclude by discussing the strengths and limitations of fcMRI and how it can be combined with HARDI techniques to support the emerging field of human connectomics.
Figures
Fig. 1.
The basis of functional connectivity MRI (fcMRI). Low-frequency spontaneous fluctuations in the blood-oxygenation-level-dependent (BOLD) signal are correlated over time between regions within the same brain systems. Examples from a single subject depict correlated spontaneous fluctuations between left and right motor cortex (top) and the absence of correlation between motor and visual regions (bottom). fcMRI methods make use of the selective correlations between regions to map the organization of brain systems. L, left; R, right; MOT, motor cortex; VIS, visual cortex.
Fig. 2.
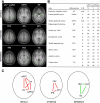
Definition of seed regions and networks used for analysis. The analyses in the present paper used a common set of seed regions and networks (see
methods
) that are illustrated here. The default network (default) and the dorsal attention system (attention), two brain networks commonly reported in the literature, were used to measure functional connectivity signal strength. A set of regions within primary motor, visual, and auditory cortex that do not typically show correlation were used as a reference (reference). A: locations of regions of interest (ROIs) are overlaid on the averaged anatomical scan of all subjects from dataset 1. All image sections and atlas coordinates here and elsewhere are referenced to the Montreal Neurological Institute (MNI) coordinate system (Evans et al. 1993). B: the ROIs with their abbreviation, laterality, and coordinates are listed. C: schematic representations of the default, attention, and reference networks. The mean correlation among default network regions and, separately, among attention network regions are expected to be high and positive (red lines). The mean correlation among reference regions is expected to be near 0 (green lines). The mean correlations in the default, attention, and reference regions were used as the dependent measures in the present paper to determine the influences of various paradigm and processing manipulations on functional connectivity analysis. Left is displayed on the left. Med, medial. For display purposes, in case of bilateral regions, only the right region is shown in C although the BOLD signal was averaged across the ROIs from both hemispheres.
Fig. 3.
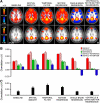
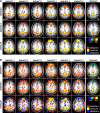
The influence of preprocessing steps on correlation estimates. Prior to fcMRI analysis, data undergo a series of preprocessing steps. The influences of preprocessing steps on both positive and negative correlations are illustrated. A: fcMRI maps with the posterior cingulate (pC) used as a seed region are shown for the sample of 48 subjects from dataset 1 at two different thresholds. Each map illustrates the effect of an additional preprocessing step (e.g., baseline includes no preprocessing; spatial smooth includes only the spatial smooth; temporal filter includes both spatial smoothing and the low-pass temporal filter). Note that robust negative correlations (also called “anticorrelations”) emerge following whole-brain regression. B: mean correlation strength within and between the default, attention, and reference networks are quantified. Note that the relative correlation strengths are largely preserved across processing steps. Differences between networks enhance with subsequent steps and the correlation in the reference network approches zero when whole-brain (global) regression is implemented. C: an estimate of spurious correlations/noise is plotted. Noise is here defined as the absolute mean value of correlations with the pC seed region in selected brain regions that typically reveal minimal correlation with the pC seed region.
Fig. 4.
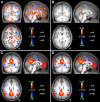
Appropriate data preprocessing minimizes the effect of respiration on functional connectivity. Correlation maps with signal variation due to respiration from dataset 6 are shown before (A) and after (B) application of the full sequence of fcMRI preprocessing steps that are illustrated in Fig. 3 (the data for A underwent preprocessing up to and including Gaussian smoothing). Note that the respiration signal correlations are present in the raw data and also that they are largely removed by preprocessing. Correlation maps with the pC seed region are shown following preprocessing without (C) and with (D) additional removal of respiration variation. Note that after preprocessing, the additional removal of respiration-correlated signals minimally influences the results. These combined observations suggest that respiration influences the data but the effect can be effectively minimized by appropriate data preprocessing.
Fig. 5.
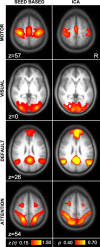
Similar functional connectivity results are obtained by seed-based and independent component analysis (ICA) techniques. Left: images were obtained using seed-based fcMRI for regions within motor, visual, default, and attention networks (computed with Mot, Vis, pC, and IPS seed regions from Fig. 2). Right: images were obtained from the same data using ICA as implemented by MELODIC software (Beckmann and Smith 2004). Note that the 2 approaches, for the networks analyzed in this paper, yield convergent results.
Fig. 6.
Similarities between seed-based and ICA measures of the default network. Mean correlation among default network regions as measured by the seed-based approach was significantly correlated with the goodness of fit of the default component obtained by ICA.
Fig. 7.
Quantitative estimates of functional connectivity strengths are reliable across sessions on separate days. Functional connectivity estimates for the default, attention, and reference networks from dataset 2 are plotted for each of 6 subjects across 2 days. Each point represents the mean correlation strength within 1 network for 1 subject. Reliability across sessions was high with correlations of 0.85 (A) when 8 functional runs were analyzed per subject (total of 41-min and 20-s rest data per session). and 0.71 (B) when only a single functional run was analyzed per subject (total of 5-min and 10-s rest data per session). Note that longer acquisitions did improve reliability, however, surprisingly reliable estimates were obtained with only ∼5 min of data per subject.
Fig. 8.
Quantitative estimates of functional connectivity strength are reliable across 2 BOLD runs from a single scan session. Reliability of measures of the default, attention, and reference network was explored across 2 BOLD runs from a single scan session (dataset 1). Six minutes of rest data were used for each run and independently processed with run order counterbalanced. Each point represents a unique subject. Moderately high test-retest reliably was obtained for the default and attention networks. Lower, nonsignificant correlation was obtained for the reference network.
Fig. 9.
Functional connectivity networks are reliable across data sessions and between individual subjects. Reliability of functional connectivity maps for pC is depicted in the overlap image for 8 runs per subject (A) and 1 run per subject (B). Data are the same as Fig. 7. Variability of pC seed correlation maps across participants is depicted in the overlap image in the far right of both A and B. Maps of individual subjects were thresholded at z(r) >0.25. Note that the map estimate and reliability improve with data averaging but also that a single functional run of ∼5 min is sufficient to produce results that are reliable across sessions and reproducible between subjects.
Fig. 10.
Functional connectivity networks are reliable across independent subject groups. Functional connectivity maps for motor, visual, default, and attention networks were highly similar across 4 independent datasets. Far right: overlap across different datasets; voxels common across all 4 groups are colored yellow. Each dataset combines 12 participants from dataset 1. Seed regions were the same as given in Fig. 2.
Fig. 11.
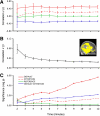
Functional connectivity networks can be assessed using brief acquisition times. Functional connectivity analysis was performed for incremental durations of scan times ranging from 2 to 12 min for 6 subjects. A: correlation strengths within and between default, attention, and reference networks. Estimates of correlation strengths stabilize rapidly. B: noise, defined as spurious correlations in selected regions (the inserted image depicts the mask of these regions), decreases with increasing acquisition time. C: the mean within-subject significance probability is plotted for each network to show the ability to detect significant correlations. P values are estimated using a model that computes effective degrees of freedom taking into account the temporal correlation of the time series (see text). Error bars represent SE.
Fig. 12.
Functional connectivity strength is similar for early, middle, and late positions within a run. Functional connectivity strength within and between default, attention, and reference networks are depicted for rest data of 4 min each from the early, middle, and late periods of a 12-min run. Position within a run has minimal effect. Error bars represent SE.
Fig. 13.
Functional connectivity strength depends minimally on run structure, temporal resolution, and spatial resolution. Functional connectivity strengths are shown within and between default, attention, and reference networks for differences in the run structure (either 1 12-min run, or 2 6-min runs), temporal resolution (2.5 or 5.0 s TR), or spatial resolution (2 or 3 mm isotropic voxels). Comparisons between conditions did not reveal any statistically significant differences. Because higher temporal resolution required sampling only a portion of the brain (Dataset 3c), estimates of correlation strength among attention network regions were not available for temporal- and spatial resolution comparisons (see text).
Fig. 14.
Functional connectivity strength is influenced by task. Functional connectivity strengths are shown within default, attention, and reference networks while subject performed different tasks during data acquisition. Functional connectivity strength was significantly diminished for eyes closed rest (ECR) when compared with the fixation (fix) condition (see text). Having the subjects open their eyes (eyes open rest, EOR) mitigated this effect. Having the participants engage a continuous self-paced classification task (class) resulted in the weakest correlations. Thus having the subject rest with their eyes open or fixating generates the strongest correlations in the networks explored here. Error bars represent SE.
Fig. 15.
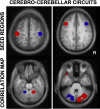
Functional connectivity reveals segregated fronto-cerebellar circuits. Two distinct cerebro-cerebellar circuits are mapped using right- and left seed regions (top) to illustrate the application of fcMRI and its sensitivity to detect anatomic circuitry. The cerebellar maps (bottom) display the functional connectivity differences between the lateralized seed regions. The maps reveal the contralateral projections of the cerebral cortex to the cerebellum and show segregated projections for motor (left) and prefrontal (right) circuits. The ability of fcMRI to map segregated, contralateral cereballar projections from the cerebral cortex demonstrates that fcMRI is constrained by anatomy and also that functional correlations reflect polysynaptic connectivity. Adapted from Krienen and Buckner (2009).
Similar articles
- Striatal functional connectivity networks are modulated by fMRI resting state conditions.
Gopinath K, Ringe W, Goyal A, Carter K, Dinse HR, Haley R, Briggs R. Gopinath K, et al. Neuroimage. 2011 Jan 1;54(1):380-8. doi: 10.1016/j.neuroimage.2010.07.021. Epub 2010 Jul 14. Neuroimage. 2011. PMID: 20637878 - Alterations in resting functional connectivity due to recent motor task.
Tung KC, Uh J, Mao D, Xu F, Xiao G, Lu H. Tung KC, et al. Neuroimage. 2013 Sep;78:316-24. doi: 10.1016/j.neuroimage.2013.04.006. Epub 2013 Apr 11. Neuroimage. 2013. PMID: 23583747 Free PMC article. - Exploring functional connectivity networks with multichannel brain array coils.
Anteraper SA, Whitfield-Gabrieli S, Keil B, Shannon S, Gabrieli JD, Triantafyllou C. Anteraper SA, et al. Brain Connect. 2013;3(3):302-15. doi: 10.1089/brain.2012.0113. Epub 2013 May 16. Brain Connect. 2013. PMID: 23510203 - Functional connectivity MRI in infants: exploration of the functional organization of the developing brain.
Smyser CD, Snyder AZ, Neil JJ. Smyser CD, et al. Neuroimage. 2011 Jun 1;56(3):1437-52. doi: 10.1016/j.neuroimage.2011.02.073. Epub 2011 Mar 3. Neuroimage. 2011. PMID: 21376813 Free PMC article. Review. - Measuring and manipulating brain connectivity with resting state functional connectivity magnetic resonance imaging (fcMRI) and transcranial magnetic stimulation (TMS).
Fox MD, Halko MA, Eldaief MC, Pascual-Leone A. Fox MD, et al. Neuroimage. 2012 Oct 1;62(4):2232-43. doi: 10.1016/j.neuroimage.2012.03.035. Epub 2012 Mar 19. Neuroimage. 2012. PMID: 22465297 Free PMC article. Review.
Cited by
- Cerebral cartography and connectomics.
Sporns O. Sporns O. Philos Trans R Soc Lond B Biol Sci. 2015 May 19;370(1668):20140173. doi: 10.1098/rstb.2014.0173. Philos Trans R Soc Lond B Biol Sci. 2015. PMID: 25823870 Free PMC article. Review. - Frequency modulation increases the specificity of time-resolved connectivity: A resting-state fMRI study.
Faghiri A, Yang K, Faria A, Ishizuka K, Sawa A, Adali T, Calhoun V. Faghiri A, et al. Netw Neurosci. 2024 Oct 1;8(3):734-761. doi: 10.1162/netn_a_00372. eCollection 2024. Netw Neurosci. 2024. PMID: 39355435 Free PMC article. - Toward a neurometric foundation for probabilistic independent component analysis of fMRI data.
Poppe AB, Wisner K, Atluri G, Lim KO, Kumar V, Macdonald AW 3rd. Poppe AB, et al. Cogn Affect Behav Neurosci. 2013 Sep;13(3):641-59. doi: 10.3758/s13415-013-0180-8. Cogn Affect Behav Neurosci. 2013. PMID: 23836423 - Local signal time-series during rest used for areal boundary mapping in individual human brains.
Hirose S, Watanabe T, Jimura K, Katsura M, Kunimatsu A, Abe O, Ohtomo K, Miyashita Y, Konishi S. Hirose S, et al. PLoS One. 2012;7(5):e36496. doi: 10.1371/journal.pone.0036496. Epub 2012 May 4. PLoS One. 2012. PMID: 22574171 Free PMC article. - Altered thalamic connectivity in insomnia disorder during wakefulness and sleep.
Zou G, Li Y, Liu J, Zhou S, Xu J, Qin L, Shao Y, Yao P, Sun H, Zou Q, Gao JH. Zou G, et al. Hum Brain Mapp. 2021 Jan;42(1):259-270. doi: 10.1002/hbm.25221. Epub 2020 Oct 13. Hum Brain Mapp. 2021. PMID: 33048406 Free PMC article.
References
- Aguirre GK, Zarahn E, D'Esposito M. Empirical analyses of BOLD fMRI statistics. II. Spatially smoothed data collected under null-hypothesis and experimental conditions. Neuroimage 5: 199–212, 1997 - PubMed
- Allen G, McColl R, Barnard H, Ringe WK, Fleckenstein J, Cullum CM. Magnetic resonance imaging of cerebellar-prefrontal and cerebellar-parietal functional connectivity. Neuroimage 28: 39–48, 2005 - PubMed
- Amann M, Hirsch JG, Gass A. A serial functional connectivity MRI study in healthy individuals assessing the variability of connectivity measures: Reduced interhemispheric connectivity in the motor network during continuous performance. Magn Reson Imaging 27: 1347–1359, 2009 - PubMed
Publication types
MeSH terms
Substances
Grants and funding
- HHMI/Howard Hughes Medical Institute/United States
- R01 AG034556-02/AG/NIA NIH HHS/United States
- K01 AT000694/AT/NCCIH NIH HHS/United States
- R01 AG034556-03/AG/NIA NIH HHS/United States
- R21 AT003425/AT/NCCIH NIH HHS/United States
LinkOut - more resources
Full Text Sources
Other Literature Sources
Medical

