Concordant regulation of translation and mRNA abundance for hundreds of targets of a human microRNA - PubMed (original) (raw)
Concordant regulation of translation and mRNA abundance for hundreds of targets of a human microRNA
David G Hendrickson et al. PLoS Biol. 2009 Nov.
Abstract
MicroRNAs (miRNAs) regulate gene expression posttranscriptionally by interfering with a target mRNA's translation, stability, or both. We sought to dissect the respective contributions of translational inhibition and mRNA decay to microRNA regulation. We identified direct targets of a specific miRNA, miR-124, by virtue of their association with Argonaute proteins, core components of miRNA effector complexes, in response to miR-124 transfection in human tissue culture cells. In parallel, we assessed mRNA levels and obtained translation profiles using a novel global approach to analyze polysomes separated on sucrose gradients. Analysis of translation profiles for approximately 8,000 genes in these proliferative human cells revealed that basic features of translation are similar to those previously observed in rapidly growing Saccharomyces cerevisiae. For approximately 600 mRNAs specifically recruited to Argonaute proteins by miR-124, we found reductions in both the mRNA abundance and inferred translation rate spanning a large dynamic range. The changes in mRNA levels of these miR-124 targets were larger than the changes in translation, with average decreases of 35% and 12%, respectively. Further, there was no identifiable subgroup of mRNA targets for which the translational response was dominant. Both ribosome occupancy (the fraction of a given gene's transcripts associated with ribosomes) and ribosome density (the average number of ribosomes bound per unit length of coding sequence) were selectively reduced for hundreds of miR-124 targets by the presence of miR-124. Changes in protein abundance inferred from the observed changes in mRNA abundance and translation profiles closely matched changes directly determined by Western analysis for 11 of 12 proteins, suggesting that our assays captured most of miR-124-mediated regulation. These results suggest that miRNAs inhibit translation initiation or stimulate ribosome drop-off preferentially near the start site and are not consistent with inhibition of polypeptide elongation, or nascent polypeptide degradation contributing significantly to miRNA-mediated regulation in proliferating HEK293T cells. The observation of concordant changes in mRNA abundance and translational rate for hundreds of miR-124 targets is consistent with a functional link between these two regulatory outcomes of miRNA targeting, and the well-documented interrelationship between translation and mRNA decay.
Conflict of interest statement
The authors have declared that no competing interests exist.
Figures
Figure 1. miR-124 recruits hundreds of specific mRNAs to Argonautes.
(A) Supervised hierarchical clustering of the enrichment profiles of putative miR-124 Ago IP targets (1% local FDR) in Ago IPs from miR-124–transfected cells (blue) and mock-transfected cells (black). Rows correspond to 789 sequences (representing 623 genomic loci with a RefSeq sequence), and columns represent individual experiments. The color scale encompasses a range from 0.06- to 16-fold relative to global mean IP enrichment for each mRNA (−4 to +4 logs on log base 2 scale ). (B) Enrichment of seed matches to miR-124 in the 3′-UTRs and coding sequences of miR-124 Ago IP targets (1% local FDR). The significance of enrichment of seed matches in Ago IP targets was measured using the hypergeometric distribution function.
Figure 2. Systematic translation profiling by microarray analysis.
(A) Schematic of the procedure used to systematically measure each gene's mRNA ribosome occupancy (see Results and Materials and Methods for details). (B) Schematic of the “gradient encoding” method to measure the average number of ribosomes bound to each gene's mRNAs (see Results and Materials and Methods for details).
Figure 3. Analysis of ribosome occupancy and ribosome density in HEK293T cells.
(A) The number of genes as a function of ribosome occupancy. The average ribosome occupancy is 85%. (B) The number of genes as a function of ribosome density. On average, there is one ribosome per 189 nucleotides. (C) Ribosome density as a function of a gene's coding sequence length. Each gene is indicated by a blue circle. The red line indicates the moving average density value (window of 50). The inset shows only genes with coding sequences that are shorter than 1,000 nucleotides.
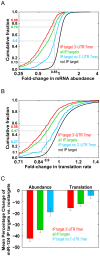
Figure 4. miR-124 negatively regulates the abundance and translation of mRNA targets.
(A) Cumulative distribution of the change in mRNA levels following transfection with miR-124 compared to mock. This analysis compares miR-124 Ago IP targets (1% local FDR) (560, green), IP targets with at least one 3′-UTR 7mer seed match (379, red), IP targets that lacked a 3′-UTR 7 mer seed match (181, blue), and nontargets (7,825, black). mRNA levels of miR-124 Ago IP targets were more likely than nontargets to decrease following transfection with miR-124 (p<10−173). (B) Cumulative distribution of the change in the estimated translation rate following transfection with miR-124 compared to mock. This analysis compares miR-124 Ago IP targets (1% local FDR) (green), IP targets with at least one 3′-UTR 7 mer seed match (red), IP targets that lacked a 3′-UTR 7mer seed match (blue), and nontargets (black). Translation rates of miR-124 Ago IP targets were more likely than nontargets to decrease following transfection with miR-124 (p<10−61). (C) Bar plot showing the average change in mRNA abundance (left) and translation rate (right) following transfection with miR-124 of all miR-124 Ago IP targets (green), IP targets with at least one 3′-UTR 7mer seed match (red), IP targets that lacked a 3′-UTR 7mer seed match (blue). The average change in mRNA abundance and translation of targets was calculated by subtracting the average change of nontargets for the mRNA abundance and translation rate measurements following transfection with miR-124. The error bars represent 95% confidence intervals in the mean difference estimated by bootstrap analysis.
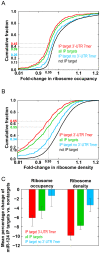
Figure 5. miR-124 Ago IP targets decrease in ribosome occupancy and ribosome density due to the presence of miR-124.
(A) Cumulative distribution of the change in ribosome occupancy following transfection with miR-124, compared to mock. This analysis compares miR-124 Ago IP targets (1% local FDR) (green), IP targets with at least one 3′-UTR 7 mer seed match (red), IP targets that lacked a 3′-UTR 7mer seed match (blue), and nontargets (black). Changes in ribosome occupancy of miR-124 Ago IP targets were greater than those for nontargets (p<10−31). (B) Cumulative distribution of the change in ribosome density following transfection with miR-124 compared to mock. This analysis compares miR-124 Ago IP targets (1% local FDR) (green), IP targets with at least one 3′-UTR 7 mer seed match (red), IP targets that lacked a 3′-UTR 7 mer seed match (blue), and nontargets (black). Changes in ribosome density of miR-124 Ago IP targets were greater than those for nontargets (p<10−51). (C) Bar plot of the average change in ribosome occupancy (left) and ribosome density (right) following transfection with miR-124 of all miR-124 Ago IP targets (green), IP targets with at least one 3′-UTR 7mer seed match (red), IP targets that lacked a 3′-UTR 7mer seed match (blue). The average change in ribosome occupancy and ribosome density of targets was calculated by subtracting the average change of nontargets for the ribosome occupancy and ribosome density measurements following transfection with miR-124. The error bars represent 95% confidence intervals in the mean difference estimated by bootstrap analysis.
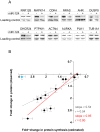
Figure 6. The effect of miR-124 transfection on protein production of miR-124 targets.
(A) Western blots of 12 proteins encoded by mRNAs highly enriched in miR-124 Ago IPs from mock-transfected cells (−) and miR-124 transfected cells (+). The bottom bands are loading controls. The proteins are arranged according to decreasing estimated fold-change in protein synthesis from left to right. (B) Scatterplot between estimated changes in protein synthesis (_x_-axis) and observed changes in protein levels (_y_-axis) from Western blots. The gray line is a least-squares linear regression fit of all 12 proteins, and the red line is a least-squares fit of 11 proteins, excluding RNF128 (upper left protein, shown in blue).
Figure 7. Concordant changes in mRNA abundance and translation of miR-124 Ago IP targets.
Scatterplot between changes in mRNA abundance (_x_-axis) and the estimated translation rate (_y_-axis) for miR-124 Ago IP targets following transfection with miR-124 compared to mock. The gray line is a least-squares linear regression fit of the data, and the red line is a moving average plot (window of 10). The slope of the least-squares fit of the data is 0.24 (in linear space, 0.36), and the Pearson correlation is 0.60.
Similar articles
- Ribosome profiling shows that miR-430 reduces translation before causing mRNA decay in zebrafish.
Bazzini AA, Lee MT, Giraldez AJ. Bazzini AA, et al. Science. 2012 Apr 13;336(6078):233-7. doi: 10.1126/science.1215704. Epub 2012 Mar 15. Science. 2012. PMID: 22422859 Free PMC article. - Contributions of mRNA abundance, ribosome loading, and post- or peri-translational effects to temporal repression of C. elegans heterochronic miRNA targets.
Stadler M, Artiles K, Pak J, Fire A. Stadler M, et al. Genome Res. 2012 Dec;22(12):2418-26. doi: 10.1101/gr.136515.111. Epub 2012 Aug 1. Genome Res. 2012. PMID: 22855835 Free PMC article. - Genome-wide identification of translationally inhibited and degraded miR-155 targets using RNA-interacting protein-IP.
Meier J, Hovestadt V, Zapatka M, Pscherer A, Lichter P, Seiffert M. Meier J, et al. RNA Biol. 2013 Jun;10(6):1018-29. doi: 10.4161/rna.24553. Epub 2013 Apr 15. RNA Biol. 2013. PMID: 23673373 Free PMC article. - A parsimonious model for gene regulation by miRNAs.
Djuranovic S, Nahvi A, Green R. Djuranovic S, et al. Science. 2011 Feb 4;331(6017):550-3. doi: 10.1126/science.1191138. Science. 2011. PMID: 21292970 Free PMC article. Review. - MicroRNAs silence gene expression by repressing protein expression and/or by promoting mRNA decay.
Behm-Ansmant I, Rehwinkel J, Izaurralde E. Behm-Ansmant I, et al. Cold Spring Harb Symp Quant Biol. 2006;71:523-30. doi: 10.1101/sqb.2006.71.013. Cold Spring Harb Symp Quant Biol. 2006. PMID: 17381335 Review.
Cited by
- MiR-3150b-3p inhibits the proliferation and invasion of cervical cancer cells by targeting TNFRSF11a.
Yu Z, Wang L, Li X. Yu Z, et al. J Investig Med. 2020 Aug;68(6):1166-1170. doi: 10.1136/jim-2020-001284. Epub 2020 Jul 2. J Investig Med. 2020. PMID: 32616510 Free PMC article. - A Myc-microRNA network promotes exit from quiescence by suppressing the interferon response and cell-cycle arrest genes.
Polioudakis D, Bhinge AA, Killion PJ, Lee BK, Abell NS, Iyer VR. Polioudakis D, et al. Nucleic Acids Res. 2013 Feb 1;41(4):2239-54. doi: 10.1093/nar/gks1452. Epub 2013 Jan 8. Nucleic Acids Res. 2013. PMID: 23303785 Free PMC article. - Translational inhibition by deadenylation-independent mechanisms is central to microRNA-mediated silencing in zebrafish.
Mishima Y, Fukao A, Kishimoto T, Sakamoto H, Fujiwara T, Inoue K. Mishima Y, et al. Proc Natl Acad Sci U S A. 2012 Jan 24;109(4):1104-9. doi: 10.1073/pnas.1113350109. Epub 2012 Jan 9. Proc Natl Acad Sci U S A. 2012. PMID: 22232654 Free PMC article. - Select microRNAs are essential for early development in the sea urchin.
Song JL, Stoeckius M, Maaskola J, Friedländer M, Stepicheva N, Juliano C, Lebedeva S, Thompson W, Rajewsky N, Wessel GM. Song JL, et al. Dev Biol. 2012 Feb 1;362(1):104-13. doi: 10.1016/j.ydbio.2011.11.015. Epub 2011 Dec 3. Dev Biol. 2012. PMID: 22155525 Free PMC article. - Re-thinking miRNA-mRNA interactions: intertwining issues confound target discovery.
Cloonan N. Cloonan N. Bioessays. 2015 Apr;37(4):379-88. doi: 10.1002/bies.201400191. Epub 2015 Feb 12. Bioessays. 2015. PMID: 25683051 Free PMC article.
References
- Lee R. C, Feinbaum R. L, Ambros V. The C. elegans heterochronic gene lin-4 encodes small RNAs with antisense complementarity to lin-14. Cell. 1993;75:843–854. - PubMed
- Bartel D. P. MicroRNAs: genomics, biogenesis, mechanism, and function. Cell. 2004;116:281–297. - PubMed
- Filipowicz W, Bhattacharyya S. N, Sonenberg N. Mechanisms of post-transcriptional regulation by microRNAs: are the answers in sight? Nat Rev Genet. 2008;9:102–114. - PubMed
- Lewis B. P, Burge C. B, Bartel D. P. Conserved seed pairing, often flanked by adenosines, indicates that thousands of human genes are microRNA targets. Cell. 2005;120:15–20. - PubMed
Publication types
MeSH terms
Substances
Grants and funding
- R01 CA077097/CA/NCI NIH HHS/United States
- T32 CA009151/CA/NCI NIH HHS/United States
- HHMI/Howard Hughes Medical Institute/United States
- GM46383/GM/NIGMS NIH HHS/United States
- R01 GM046383/GM/NIGMS NIH HHS/United States
- R01 CA77097-08/CA/NCI NIH HHS/United States
- T32 HG000044/HG/NHGRI NIH HHS/United States
- K22 HG000044/HG/NHGRI NIH HHS/United States
- HG00044/HG/NHGRI NIH HHS/United States
- 2T32CA09151/CA/NCI NIH HHS/United States
LinkOut - more resources
Full Text Sources
Other Literature Sources
Molecular Biology Databases


