Resolvin E1 receptor activation signals phosphorylation and phagocytosis - PubMed (original) (raw)
Resolvin E1 receptor activation signals phosphorylation and phagocytosis
Taisuke Ohira et al. J Biol Chem. 2010.
Abstract
Resolvins are endogenous lipid mediators that actively regulate the resolution of acute inflammation. Resolvin E1 (RvE1; (5S,12R,18R)-trihydroxy-6Z,8E,10E,14Z,16E-eicosapentaenoic acid) is an endogenous anti-inflammatory and pro-resolving mediator derived from eicosapentaenoic acid that regulates leukocyte migration and enhances macrophage phagocytosis of apoptotic neutrophils to resolve inflammation. In the inflammatory milieu, RvE1 mediates counter-regulatory actions initiated via specific G protein-coupled receptors. Here, we have identified RvE1-specific signaling pathways initiated by the RvE1 receptor ChemR23. RvE1 stimulated phosphorylation of Akt that was both ligand- and receptor-dependent. RvE1 regulated Akt phosphorylation in a time (0-15 min)- and dose-dependent (0.01-100 nm) manner in human ChemR23-transfected Chinese hamster ovary cells. RvE1 stimulated phosphorylation of both Akt and a 30-kDa protein, a downstream target of Akt, identified using a phospho-Akt substrate antibody. The 30-kDa protein was identified as ribosomal protein S6, a translational regulator, and its phosphorylation was inhibited by a phosphatidylinositol 3-kinase (PI3K) inhibitor (wortmannin) and an ERK inhibitor (PD98059) but not by a p38-MAPK inhibitor (SB203580). Ribosomal protein S6 is a downstream target of the PI3K/Akt signaling pathway as well as the Raf/ERK pathway. In ChemR23-expressing differentiated HL60 cells, RvE1 also stimulated the phosphorylation of ribosomal protein S6. In addition, RvE1 enhanced phagocytosis of zymosan A by human macrophages, which are inhibited by PD98059 and rapamycin (mTOR inhibitor). These results indicate that RvE1 initiates direct activation of ChemR23 and signals receptor-dependent phosphorylation. These phosphorylation-signaling pathways identified for RvE1 receptor-ligand interactions underscore the importance of endogenous pro-resolving agonists in resolving acute inflammation.
Figures
FIGURE 1.
Surface expression of human ChemR23 in CHO cells and RvE1-specific binding. A, immunofluorescence microscopy analysis of ChemR23 cell surface expression. CHO-hChemR23 cells (left) or CHO-mock cells (right) were stained with anti-human ChemR23 Ab followed by secondary Ab labeled with Alexa Fluor® 488 (green), and nuclei were labeled with DAPI (blue) as described under “Experimental Procedures.” B, flow cytometric analysis of ChemR23 cell surface expression. CHO-hChemR23 cells (left) or CHO-mock cells (right) were stained with anti-human ChemR23 Ab (green, open histogram) or isotype control IgG3 (purple, filled histogram) and FITC-labeled secondary Ab as described under “Experimental Procedures.” C, competitive binding. CHO-hChemR23 cells (closed circles) or CHO-mock cells (open squares) were incubated at 4 °C with [3H]RvE1 (10 n
m
) in the presence of the indicated concentration of RvE1 (10−10 to 10−6
m
) to determine the competition for specific [3H]RvE1 binding. Results represent the mean values ± S.E. for six separate experiments. D, displacement of equilibrium-bound [3H]RvE1 in CHO-hChemR23 cells. Cells (1.0 × 10⁶ cells/0.5 ml) were incubated at 4 °C in the presence of [3H]RvE1 (5 n
m
). After 10 min (denoted by arrow), unlabeled RvE1 (2 μ
m
; open circles) was added to incubations. In the absence of RvE1, the [3H]RvE1-specific binding did not decline for the time intervals indicated (closed circles). Results are representative of at least three separate experiments. E, [3H]RvE1-specific binding in CHO-hChemR23 cells. Cells were incubated in the indicated concentrations of [3H]RvE1 (0.5–10.0 n
m
) in the presence or absence of unlabeled RvE1 (2 μ
m
) for 1 h at 4 °C to determine [3H]RvE1-specific binding. Results represent the mean values ± S.E. for five separate experiments.
FIGURE 2.
RvE1 regulates phosphorylation of a 30-kDa protein (p30) via human ChemR23. A, RvE1 regulates the phosphorylation of p30 in a concentration-dependent manner. Whole cell lysates were extracted from CHO-hChemR23 cells incubated with RvE1 (0.01–100.0 n
m
, 15 min, 37 °C) and analyzed by Western blotting with pAkt(S) Ab to determine the phosphoproteins as described under “Experimental Procedures.” The open arrowhead indicates the position of p30. The line graph summarizes the relative intensity of p30 phosphorylation in CHO cells treated with RvE1. Results represent the mean ± S.E. for four separate experiments (*, p < 0.05, when compared with vehicle). IB, immunoblot. B, RvE1 regulates p30 phosphorylation but not LTB4. Whole cell lysates were extracted from CHO-hChemR23 cells incubated with RvE1 (10 n
m
) or LTB4 (10 n
m
) at 37 °C for 15 min and analyzed by Western blotting with pAkt(S) Ab. The open arrowhead indicates the position of p30. The bar graph summarizes the relative intensity of p30 phosphorylation. Results represent the mean ± S.E. for three separate experiments (*, p < 0.05 when compared with vehicle).
FIGURE 3.
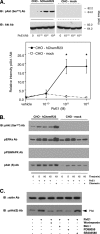
RvE1 regulates signal transduction via human ChemR23. A, RvE1 regulates Akt phosphorylation via ChemR23 in a concentration-dependent manner. Whole cell lysates were extracted from CHO-hChemR23 cells and CHO-mock cells incubated with the indicated concentrations of RvE1 (0.1–10.0 n
m
, 37 °C, 15 min) and analyzed by Western blotting with anti-pAkt (Ser473) Ab to determine the phosphorylation of Akt. The line graph summarizes the relative intensity of Akt phosphorylation. Results represent the mean ± S.E. for three separate data experiments (*, p < 0.05, when compared with vehicle in CHO-hChemR23 cells). IB, immunoblot. B, RvE1 regulates signal transduction in a time-dependent manner. Whole cell lysates were extracted from CHO-hChemR23 cells incubated with RvE1 (10 n
m
) or chemerin (100 n
m
) for the indicated time periods. Protein phosphorylation was assessed by Western blotting using phospho-Akt, ERK, p38-MAPK, and pAkt(S) antibodies as described under “Experimental Procedures.” C, reduction of RvE1-enhanced p30 phosphorylation by pharmacological inhibitors. Whole cell lysates were extracted from CHO-hChemR23 cells incubated with wortmannin (200 n
m
), PD98059 (50 μ
m
), or SB203580 (10 μ
m
) and Bim I (1 μ
m
) for 15 min. Cells were exposed to RvE1 (10 n
m
, 37 °C, 15 min) and analyzed by Western blotting with pAkt(S) Ab.
FIGURE 4.
RvE1 regulates the phosphorylation of ribosomal protein S6. A, whole cell lysates were derived from CHO-hChemR23 cells treated with or without RvE1 (10 n
m
, 15 min, 37 °C) and pulled down with a mouse antibody to ribosomal protein S6 Ab. Immunoprecipitates (∼70 μg/lane) were blotted with the phospho-Akt substrate antibody (pAkt(S) Ab; lanes c and d). rS6 was detected with rS6 Ab (lanes g and h) to confirm protein loading. IB, immunoblot; IP, immunoprecipitation. B, immunofluorescence microscopy of rS6 phosphorylation. CHO-hChemR23 cells and CHO-mock cells were incubated with or without RvE1 (10 n
m
, 37 °C, 15 min). Cells were stained with anti-phospho-rS6 (Ser235/Ser236) Ab followed by Alexa Fluor® 568 secondary Ab (red) to determine the distribution of phosphorylated rS6 within the cells. Actin filaments were labeled with Alexa Fluor® 488-phalloidin (green), and nuclei were labeled with DAPI (blue) as described under “Experimental Procedures.” C, reduction of RvE1-enhanced p30 phosphorylation by pharmacological inhibitors. CHO-hChemR23 cells were incubated with wortmannin (200 n
m
), PD98059 (50 μ
m
), or SB203580 (10 μ
m
) for 15 min. Cells were then exposed to RvE1 (10 n
m
, 37 °C, 15 min) and stained with anti-phospho-rS6 (Ser235/Ser236) Ab using Alexa Fluor® 568 secondary Ab (red) to determine the phosphorylation of rS6. Actin filaments were labeled with Alexa Fluor® 488-phalloidin (green), and nuclei were labeled with DAPI (blue).
FIGURE 5.
RvE1 regulates phosphorylation of ribosomal protein S6 in PMA-differentiated HL60 cells via ChemR23. A, flow cytometric analysis of ChemR23 and CD14 surface expression. PMA-differentiated HL60 cells were stained with anti-human ChemR23 Ab (left, open green histogram) or CD14 Ab (right, open red histogram) and FITC-labeled secondary antibody. The filled histogram indicates each isotype control IgG (purple). B, immunofluorescence microscopy analysis of ChemR23 surface expression. PMA-differentiated HL60 cells or undifferentiated HL60 cells were stained with anti-human ChemR23 antibody or IgG3 isotype control followed by labeling with Alexa Fluor® 488 secondary Ab (green). Nuclei were counterstained with DAPI (blue). C, RvE1 regulates phosphorylation of rS6 in PMA-differentiated HL60 cells. Whole cell lysates were extracted from PMA-differentiated HL60 cells incubated with the indicated concentration of RvE1 (0.1–100.0 n
m
, 37 °C, 15 min) and analyzed by Western blotting with phospho-rS6 (Ser235/Ser236) Ab. The bar graph summarizes the relative intensity of phospho-rS6. Results represent the mean values ± S.E. for three separate experiments (*, p < 0.05 when compared with vehicle).
FIGURE 6.
RvE1 regulates phosphorylation of ribosomal protein S6 in human macrophages via ChemR23. A, immunofluorescence microscopy analysis of ChemR23 surface expression. Human macrophages were stained with anti-human ChemR23 antibody or IgG3 isotype control followed by labeling with Alexa Fluor® 488 secondary Ab (green) as described under “Experimental Procedures.” Nuclei were counterstained with DAPI (blue). B, flow cytometric analysis of ChemR23 surface expression. Human macrophages were stained with anti-human ChemR23 antibody (green, open histogram) or isotype control mouse IgG3 (purple, filled histogram) and FITC-labeled secondary antibody. C, reduction of RvE1-enhanced rS6 phosphorylation by pharmacological inhibitors. Whole cell lysates were extracted from human macrophages incubated with wortmannin (200 n
m
), rapamycin (20 n
m
), PD98059 (50 μ
m
), SB203580 (10 μ
m
), or Bim I (1 μ
m
) for 15 min followed by co-incubation with RvE1 (10 n
m
, 15 min, 37 °C) and then analyzed by Western blotting with phospho-rS6 (Ser 235/236) Ab. The bar graph summarizes the relative intensity of rS6 phosphorylation. Results represent the mean values ± S.E. for three separate experiments (*, p < 0.05 when compared with vehicle). D, immunofluorescence microscopy analysis of rS6 phosphorylation. Human macrophages were treated with human ChemR23 Ab (1:100 dilution), isotype control IgG3 (1:100), PD98059 (50 μ
m
), or rapamycin (20 n
m
) followed by co-incubation with RvE1 (10 n
m
, 15 min, 37 °C). Cells were stained with anti-phospho-rS6 (Ser235/Ser236) Ab using Alexa Fluor® 568 secondary Ab (red) to determine the distribution of phosphorylation of rS6 within the cells. Actin filaments were labeled with Alexa Fluor® 488-phalloidin (green), and nuclei were labeled with DAPI (blue). The bar graph summarizes the percentage of rS6-phosphorylated cells. Results represent the mean values ± S.E. for three separate experiments (*, p < 0.05 when compared with vehicle).
FIGURE 7.
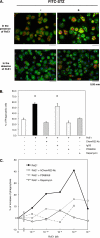
RvE1 enhances phagocytosis of FITC-STZ in human macrophages. A, RvE1-induced FITC-STZ uptake and rS6 phosphorylation in human macrophages. Macrophages (4-well chamber slides, 0.5 × 10⁶ cells/well) were treated with RvE1 (10 n
m
, 37 °C, 15 min) followed by co-incubation with or without FITC-STZ (green particles, 2.5 × 10⁶ particles/well) for 30 min at 37 °C. Cells were stained with anti-phospho-rS6 (Ser235/Ser236) Ab using Alexa Fluor® 568 secondary Ab (red) to detect the phosphorylated form of rS6. Actin filaments were labeled with Alexa Fluor® 488-phalloidin (green), and nuclei were stained with DAPI (blue). B, reduction of agonist-enhanced phagocytosis of FITC-STZ by pharmacological inhibitors. Cells were treated with ChemR23 Ab (1:100 dilution), isotype control IgG3 (1:100), PD98059 (50 μ
m
), or rapamycin (20 n
m
) for 15 min followed by RvE1 stimulus (10 n
m
, 37 °C, 15 min) and co-incubation with FITC-STZ (30 min, 37 °C). Phagocytosis was assessed by counting the percentage of cells ingesting FITC-STZ particles. Results represent the mean values ± S.E. for three separate experiments (*, p < 0.05 when compared with cells incubated with vehicle alone plus FITC-STZ). C, concentration-dependent increase in phagocytosis of FITC-STZ by human macrophages exposed to RvE1. Cells (96-well plate, 0.1 × 10⁶ cells/well) were pretreated with ChemR23 Ab (1:100 dilution), PD98059 (50 μ
m
), or rapamycin (20 n
m
) for 15 min. Cells were then treated with the indicated concentration (0.01–100.0 n
m
) at 37 °C for 15 min followed by co-incubation with FITC-STZ for 30 min at 37 °C. Phagocytosis was quantified using a fluorescent plate reader as described under “Experimental Procedures.” Results are representative of at least three separate experiments and are expressed as the percent of fluorescent intensity above cells incubated with vehicle alone plus FITC-STZ.
FIGURE 8.
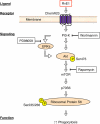
Hypothetical scheme for resolvin E1-ChemR23-dependent signaling in human macrophages. The scheme outlines the key phosphorylation-signaling components with RvE1 and the points of inhibitor action in this system. See under “Results” and legends to Figs. 2–6 for details.
Similar articles
- Stereochemical assignment, antiinflammatory properties, and receptor for the omega-3 lipid mediator resolvin E1.
Arita M, Bianchini F, Aliberti J, Sher A, Chiang N, Hong S, Yang R, Petasis NA, Serhan CN. Arita M, et al. J Exp Med. 2005 Mar 7;201(5):713-22. doi: 10.1084/jem.20042031. J Exp Med. 2005. PMID: 15753205 Free PMC article. - Resolvin E1 regulates adenosine diphosphate activation of human platelets.
Fredman G, Van Dyke TE, Serhan CN. Fredman G, et al. Arterioscler Thromb Vasc Biol. 2010 Oct;30(10):2005-13. doi: 10.1161/ATVBAHA.110.209908. Epub 2010 Aug 11. Arterioscler Thromb Vasc Biol. 2010. PMID: 20702811 Free PMC article. - Resolvin E1 metabolome in local inactivation during inflammation-resolution.
Hong S, Porter TF, Lu Y, Oh SF, Pillai PS, Serhan CN. Hong S, et al. J Immunol. 2008 Mar 1;180(5):3512-9. doi: 10.4049/jimmunol.180.5.3512. J Immunol. 2008. PMID: 18292578 - The role of polyunsaturated ω-3 fatty acid eicosapentaenoic acid-derived resolvin E1 (RvE1) in bone preservation.
Gyurko R, Van Dyke TE. Gyurko R, et al. Crit Rev Immunol. 2014;34(4):347-57. doi: 10.1615/critrevimmunol.2014009982. Crit Rev Immunol. 2014. PMID: 24941160 Free PMC article. Review. - Icosapent ethyl in cardiovascular prevention: Resolution of inflammation through the eicosapentaenoic acid - resolvin E1 - ChemR23 axis.
Bäck M. Bäck M. Pharmacol Ther. 2023 Jul;247:108439. doi: 10.1016/j.pharmthera.2023.108439. Epub 2023 May 16. Pharmacol Ther. 2023. PMID: 37201735 Review.
Cited by
- Resolution phase lipid mediators of inflammation: agonists of resolution.
Serhan CN, Chiang N. Serhan CN, et al. Curr Opin Pharmacol. 2013 Aug;13(4):632-40. doi: 10.1016/j.coph.2013.05.012. Epub 2013 Jun 6. Curr Opin Pharmacol. 2013. PMID: 23747022 Free PMC article. Review. - Roles of Specialized Pro-Resolving Lipid Mediators in Autophagy and Inflammation.
Recchiuti A, Isopi E, Romano M, Mattoscio D. Recchiuti A, et al. Int J Mol Sci. 2020 Sep 10;21(18):6637. doi: 10.3390/ijms21186637. Int J Mol Sci. 2020. PMID: 32927853 Free PMC article. Review. - MerTK signaling in macrophages promotes the synthesis of inflammation resolution mediators by suppressing CaMKII activity.
Cai B, Kasikara C, Doran AC, Ramakrishnan R, Birge RB, Tabas I. Cai B, et al. Sci Signal. 2018 Sep 25;11(549):eaar3721. doi: 10.1126/scisignal.aar3721. Sci Signal. 2018. PMID: 30254055 Free PMC article. - Monocyte biology conserved across species: Functional insights from cattle.
Talker SC, Barut GT, Lischer HEL, Rufener R, von Münchow L, Bruggmann R, Summerfield A. Talker SC, et al. Front Immunol. 2022 Jul 29;13:889175. doi: 10.3389/fimmu.2022.889175. eCollection 2022. Front Immunol. 2022. PMID: 35967310 Free PMC article. - Anti-Inflammatory Function of Fatty Acids and Involvement of Their Metabolites in the Resolution of Inflammation in Chronic Obstructive Pulmonary Disease.
Kotlyarov S, Kotlyarova A. Kotlyarov S, et al. Int J Mol Sci. 2021 Nov 26;22(23):12803. doi: 10.3390/ijms222312803. Int J Mol Sci. 2021. PMID: 34884621 Free PMC article. Review.
References
- Serhan C. N., Savill J. (2005) Nat. Immunol. 6, 1191–1197 - PubMed
- Gilroy D. W., Lawrence T., Perretti M., Rossi A. G. (2004) Nat. Rev. Drug. Discov. 3, 401–416 - PubMed
- Shimizu T. (2009) Annu. Rev. Pharmacol. Toxicol. 49, 123–150 - PubMed
Publication types
MeSH terms
Substances
Grants and funding
- GM38765/GM/NIGMS NIH HHS/United States
- P50 DE016191/DE/NIDCR NIH HHS/United States
- R37 GM038765/GM/NIGMS NIH HHS/United States
- R01 DE015566/DE/NIDCR NIH HHS/United States
- DE-015566/DE/NIDCR NIH HHS/United States
- R01 GM038765/GM/NIGMS NIH HHS/United States
- DE-016191/DE/NIDCR NIH HHS/United States
LinkOut - more resources
Full Text Sources
Other Literature Sources
Molecular Biology Databases
Research Materials
Miscellaneous


