Movement and equipositioning of plasmids by ParA filament disassembly - PubMed (original) (raw)
Movement and equipositioning of plasmids by ParA filament disassembly
Simon Ringgaard et al. Proc Natl Acad Sci U S A. 2009.
Abstract
Bacterial plasmids encode partitioning (par) loci that confer stable plasmid inheritance. We showed previously that, in the presence of ParB and parC encoded by the par2 locus of plasmid pB171, ParA formed cytoskeletal-like structures that dynamically relocated over the nucleoid. Simultaneously, the par2 locus distributed plasmids regularly over the nucleoid. We show here that the dynamic ParA patterns are not simple oscillations. Rather, ParA nucleates and polymerizes in between plasmids. When a ParA assembly reaches a plasmid, the assembly reaction reverses into disassembly. Strikingly, plasmids consistently migrate behind disassembling ParA cytoskeletal structures, suggesting that ParA filaments pull plasmids by depolymerization. The perpetual cycles of ParA assembly and disassembly result in continuous relocation of plasmids, which, on time averaging, results in equidistribution of the plasmids. Mathematical modeling of ParA and plasmid dynamics support these interpretations. Mutational analysis supports a molecular mechanism in which the ParB/parC complex controls ParA filament depolymerization.
Conflict of interest statement
The authors declare no conflict of interest.
Figures
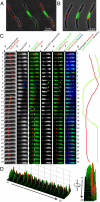
Fig. 1.
par2_-carrying plasmids trail retracting ParA on the nucleoid. (A and B) Intracellular localization of nucleoid (Hoechst stain, green) and plasmids (red) in strain SR1 harboring (A) par_− plasmid pSR230 and (B) par2+ plasmid pSR233. (C) Time lapse showing the subcellular localization of ParA-GFP and par2+ plasmid pSR233 (R1 par2+ p_lac::parA::gfp tetO120) in strain SR1 (KG22Δ_pcnB) also carrying the pBR322-based pSR124 plasmid (pBAD_::tetR::mCherry_). Numbers on the side indicate minutes in the time lapse. (Ca) Overlay of phase-contrast images and TetR-mCherry (red). (Cb) Intracellular localization of ParA-GFP. (Ac) Overlay of ParA-GFP (green) and TetR-mCherry (red). (Cd) 2D deconvolved images of ParA-GFP. (Ce) Overlay of deconvolved ParA-GFP (green) and TetR-mCherry (red). (Cf) Overlay of deconvolved ParA-GFP (green), TetR-mCherry (red), and nucleoid (blue). (Cg) Kymograph of plasmid (red) and maximum intensity of ParA-GFP signal in (Cb). A movie of the time lapse is presented in
Movie S1
. (D) 3D surface intensity plot of the dashed region of minutes 15–29 in (Cc).
Fig. 2.
Simulated kymographs and plasmid foci distributions generated by mathematical modeling. (A–C) Simulated kymographs of ParA/focus dynamics for (A) 1, (B) 2, and (C) 3 foci cases, a movie of (C) is presented in
Movie S7
. (D) Simulated kymograph of one focus splitting into 2 and being segregated. (E-G) Simulated foci distributions for (E) 1, (F) 2, and (G) 3 foci cases. For all simulated foci distributions, the distributions were built up over 7,500 min of simulated time, with sampling every 7.5 min, and means and error bars constructed from 40 independent runs. (H) Plasmid travel distance is ParA filament length dependent. (Ha) Schematics showing how the focus travel distance was measured relative to initial ParA filament length. (Hb) The plot shows the focus travel distance, Δ_c_, as function of initial ParA filament length, a. (Hc) The plot shows the ratio between focus travel distance and initial ParA filament length, Δ_c_/a, as function of initial ParA filament length, a.
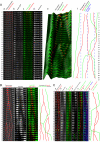
Fig. 3.
Perpetual cycles of ParA assembly/disassembly move and position plasmids. (A–C) Time lapses showing the subcellular localization of ParA-GFP and par2+ plasmids (A and B) in a cephalexin-treated cell. Numbers on the side indicate minutes in the time lapse. Experimental setup as in Fig. 1_C_. Videos of the time lapse in (A–C) are presented in
Movies S4
, S5, and S6, respectively. (Aa, Ba, and Cc) Overlay of phase-contrast images and TetR-mCherry (red). (Ab, Bb, and Cc) Intracellular localization of ParA-GFP. (Ac, Bc, and Cc) Overlay of ParA-GFP (green) and TetR-mCherry (red). (Ad) Nucleoid stained with Hoechst. (Ae) 3D surface intensity plot of (Ac). (Af) Kymograph of plasmid (red) and maximum intensity of ParA-GFP signal (green) in (Ac). Dotted blue lines indicate the average foci positions during the time lapse. (Bd and Cg) Kymograph of plasmid (red) and highest-intensity ParA-GFP signal in (Bb) and (Cb). (C) Focus splitting and segregation by ParA filaments. (Cd) Deconvolved images of ParA-GFP. (Ce) Overlay of deconvolved ParA-GFP (green) and TetR-mCherry (red). (Cf) Overlay of deconvolved ParA-GFP (green) and TetR-mCherry (red) and nucleoid (blue).
Fig. 4.
Molecular model showing how plasmid movement is generated by dynamic ParA filaments. See Discussion for a detailed description of the molecular model.
Similar articles
- Competing ParA structures space bacterial plasmids equally over the nucleoid.
Ietswaart R, Szardenings F, Gerdes K, Howard M. Ietswaart R, et al. PLoS Comput Biol. 2014 Dec 18;10(12):e1004009. doi: 10.1371/journal.pcbi.1004009. eCollection 2014 Dec. PLoS Comput Biol. 2014. PMID: 25521716 Free PMC article. - Bacterial mitosis: partitioning protein ParA oscillates in spiral-shaped structures and positions plasmids at mid-cell.
Ebersbach G, Gerdes K. Ebersbach G, et al. Mol Microbiol. 2004 Apr;52(2):385-98. doi: 10.1111/j.1365-2958.2004.04002.x. Mol Microbiol. 2004. PMID: 15066028 - The double par locus of virulence factor pB171: DNA segregation is correlated with oscillation of ParA.
Ebersbach G, Gerdes K. Ebersbach G, et al. Proc Natl Acad Sci U S A. 2001 Dec 18;98(26):15078-83. doi: 10.1073/pnas.261569598. Proc Natl Acad Sci U S A. 2001. PMID: 11752455 Free PMC article. - ParA ATPases can move and position DNA and subcellular structures.
Szardenings F, Guymer D, Gerdes K. Szardenings F, et al. Curr Opin Microbiol. 2011 Dec;14(6):712-8. doi: 10.1016/j.mib.2011.09.008. Epub 2011 Sep 29. Curr Opin Microbiol. 2011. PMID: 21963112 Review. - Pushing and pulling in prokaryotic DNA segregation.
Gerdes K, Howard M, Szardenings F. Gerdes K, et al. Cell. 2010 Jun 11;141(6):927-42. doi: 10.1016/j.cell.2010.05.033. Cell. 2010. PMID: 20550930 Review.
Cited by
- Organization and segregation of bacterial chromosomes.
Wang X, Montero Llopis P, Rudner DZ. Wang X, et al. Nat Rev Genet. 2013 Mar;14(3):191-203. doi: 10.1038/nrg3375. Epub 2013 Feb 12. Nat Rev Genet. 2013. PMID: 23400100 Free PMC article. Review. - ParA-like protein uses nonspecific chromosomal DNA binding to partition protein complexes.
Roberts MA, Wadhams GH, Hadfield KA, Tickner S, Armitage JP. Roberts MA, et al. Proc Natl Acad Sci U S A. 2012 Apr 24;109(17):6698-703. doi: 10.1073/pnas.1114000109. Epub 2012 Apr 10. Proc Natl Acad Sci U S A. 2012. PMID: 22496588 Free PMC article. - Collaborative protein filaments.
Ghosal D, Löwe J. Ghosal D, et al. EMBO J. 2015 Sep 14;34(18):2312-20. doi: 10.15252/embj.201591756. Epub 2015 Aug 12. EMBO J. 2015. PMID: 26271102 Free PMC article. Review. - The ParMRC system: molecular mechanisms of plasmid segregation by actin-like filaments.
Salje J, Gayathri P, Löwe J. Salje J, et al. Nat Rev Microbiol. 2010 Oct;8(10):683-92. doi: 10.1038/nrmicro2425. Nat Rev Microbiol. 2010. PMID: 20844556 Review. - Rules and Exceptions: The Role of Chromosomal ParB in DNA Segregation and Other Cellular Processes.
Kawalek A, Wawrzyniak P, Bartosik AA, Jagura-Burdzy G. Kawalek A, et al. Microorganisms. 2020 Jan 11;8(1):0. doi: 10.3390/microorganisms8010105. Microorganisms. 2020. PMID: 31940850 Free PMC article. Review.
References
- Ebersbach G, Gerdes K. Bacterial mitosis: Partitioning protein ParA oscillates in spiral-shaped structures and positions plasmids at mid-cell. Mol Microbiol. 2004;52:385–398. - PubMed
- Adachi S, Hori K, Hiraga S. Subcellular positioning of F plasmid mediated by dynamic localization of SopA and SopB. J Mol Biol. 2006;356:850–863. - PubMed
Publication types
MeSH terms
Substances
Grants and funding
- BB/C519670/1/BB_/Biotechnology and Biological Sciences Research Council/United Kingdom
- BBS/E/J/000C0620/BB_/Biotechnology and Biological Sciences Research Council/United Kingdom
LinkOut - more resources
Full Text Sources
Other Literature Sources


