AMPH-1/Amphiphysin/Bin1 functions with RME-1/Ehd1 in endocytic recycling - PubMed (original) (raw)
. 2009 Dec;11(12):1399-410.
doi: 10.1038/ncb1986. Epub 2009 Nov 15.
Affiliations
- PMID: 19915558
- PMCID: PMC2788952
- DOI: 10.1038/ncb1986
AMPH-1/Amphiphysin/Bin1 functions with RME-1/Ehd1 in endocytic recycling
Saumya Pant et al. Nat Cell Biol. 2009 Dec.
Abstract
RME-1/EHD1 (receptor mediated endocytosis/Eps15 homology-domain containing 1) family proteins are key residents of the recycling endosome, which are required for endosome-to-plasma membrane transport in Caenorhabditis elegans and mammals. Recent studies suggest similarities between the RME-1/EHD proteins and the Dynamin GTPase superfamily of mechanochemical pinchases, which promote membrane fission. Here we show that endogenous C. elegans AMPH-1, the only C. elegans member of the Amphiphysin/BIN1 family of BAR (Bin1-Amphiphysin-Rvs161p/167p)-domain-containing proteins, colocalizes with RME-1 on recycling endosomes in vivo, that amph-1-deletion mutants are defective in recycling endosome morphology and function, and that binding of AMPH-1 Asn-Pro-Phe(Asp/Glu) sequences to the RME-1 EH-domain promotes the recycling of transmembrane cargo. We also show a requirement for human BIN1 (also known as Amphiphysin 2) in EHD1-regulated endocytic recycling. In vitro, we find that purified recombinant AMPH-1-RME-1 complexes produce short, coated membrane tubules that are qualitatively distinct from those produced by either protein alone. Our results indicate that AMPH-1 and RME-1 cooperatively regulate endocytic recycling, probably through functions required for the production of cargo carriers that exit the recycling endosome for the cell surface.
Figures
Figure 1
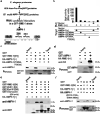
AMPH-1 physically interacts with RME-1. (a) A flowchart representation of the steps involved in identifying AMPH-1 as an RME-1 EH-domain interacting protein. Bioinformatic searches of the C. elegans proteome identified multi-NPF and NPF(D/E) containing candidates which were assayed for effects on GFP-RME-1 subcellular localization after RNAi-mediated depletion, leading to identification of AMPH-1, a BAR (Bin1-Amphiphysin-Rvs161p/167p) and SH3 (Src-homology domain 3) domain protein. A diagram of the C. elegans amph-1 gene indicating 5’ and 3’ untranslated regions (dark gray boxes), exons (light gray boxes), introns (connecting lines), and the location of the amph-1(tm1060) deletion. (b) RME-1 (residues 447–555) was expressed as bait in a yeast reporter strain. AMPH-1 (residues 230–394) and its mutant forms were expressed as prey in the same yeast cells. Interaction between bait and prey was assayed by quantitative β-galactosidase (β-gal) assays. Mutation of either NPF motif to NPA is sufficient to significantly disrupt the interaction. The y-axis is labeled in Miller units. n=2, data from independent experiments is indicated above the graphs. (c) Glutathione beads loaded with recombinant GST or GST-RME- 1(442–576) were incubated with _in vitro_-expressed HA-AMPH-1(+) or HA-AMPH-1(F309A, F363A). Western blot for bound proteins was probed with anti-AMPH-1 antibody. Input lanes contain 50% target protein. The lower panel shows equivalent loading of bait GST fusion proteins. (d) Glutathione beads loaded with recombinant GST or GST-AMPH-1(full length) were incubated with _in vitro_-expressed HA-RME-1(full length). Bound proteins were analyzed by Western blot probed with anti-HA antibody. Input lanes contain 10% of the target protein HA-RME-1. The lower panel shows equivalent loading of bait GST fusion proteins. (e) Glutathione beads loaded with recombinant GST, GST-RME- 1(442–576), GST-mRme1/EHD1(EH domain), GST-Eps15(EH domain 2) or GST-Intersectin(EH domains a+b) were incubated with _in vitro_-expressed target protein HA-AMPH-1(+). Bound proteins were analyzed by Western blot with anti-AMPH-1 antibody. Input lane contains 10% target protein. The lower panel shows equivalent loading of bait GST fusion proteins. (f) Glutathione beads loaded with recombinant GST or GST-RME- 1(442–576) were incubated with _in vitro_-expressed target proteins HA-AMPH-1(+) or HA-AMPH-1(D310-312A, D364-366A). Bound proteins were analyzed by western blot with anti-AMPH-1 antibody. Input lanes contain 50% of the target protein. The lower panel shows equivalent loading of bait GST fusions.
Figure 2
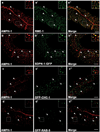
AMPH-1 co-localizes with RME-1 and SDPN-1/Syndapin on recycling endosomes. Wild type N2 worms or various GFP labeled transgenic worm strains were synchronized to the adult stage and decapitated by microsurgery. The extruded worm intestines were fixed and immunostained with antibodies for visualization of endogenous protein localization. (a-a’’) Endogenous AMPH-1 (red) labeled with rabbit polyclonal anti-AMPH-1 antibody co-localizes extensively with endogenous RME-1 labeled with mouse monoclonal antibody (green). Arrowheads indicate structures labeled by both AMPH-1 and RME-1. (b-b’’) Endogenous AMPH-1 (red) co-localizes significantly with the recycling endosome marker SDPN-1-GFP (green). Arrowheads indicate structures labeled by both AMPH-1 and SDPN-1. (c-c’’) Endogenous AMPH-1 (red) does not co-localize significantly with clathrin (GFP-CHC-1). Arrowheads indicate structures labeled by AMPH-1 and arrows indicate structures labeled by GFP-CHC-1. (d-d’’) Endogenous AMPH-1 (red) does not co-localize with the early endosome marker GFP-RAB-5 (green). Arrowheads indicate structures labeled by AMPH-1 and arrows indicate structures labeled by GFP-RAB-5. Scale bars represent 10 µm.
Figure 3
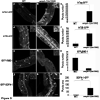
C. elegans amph-1 mutants display abnormal trafficking of recycling cargo and morphologically abnormal recycling endosomes.(a–c) hTAC-GFP, a cargo protein internalized independently of clathrin, accumulates intracellularly in amph-1 mutants. Arrowheads indicate punctate and tubular hTAC-GFP signal in the intestine. (c) Quantification of hTAC-GFP signal in the intestine of living wild-type and amph-1 mutant animals with respect to average number of labeled structures per unit area. The asterisk indicates a significant difference in the one-tailed Student’s T-test, p-value= 1.2×10⁻¹² (d–f) hTfR-GFP, a clathrin-dependent cargo protein, accumulates intracellularly in amph-1 mutants. (f) Quantification of hTfR-GFP signal in the intestine of living wild-type and amph-1 mutant animals with respect to average number of labeled structures per unit area. The asterisk indicates a significant difference in the one-tailed Student’s T-test, p value=9.7×10⁻²². (g–i) Loss of GFP-RME-1 labeling of basolateral recycling endosomes in the amph-1(tm1060) mutants. Arrowheads indicate GFP-RME-1 signal. (i) Quantification of GFP-RME-1 signal in the intestine of living wild-type and amph-1 mutant animals with respect to average number of labeled structures per unit area. The asterisk indicates a significant difference in the one-tailed Student’s T-test, p-value =1.1424×10−07. (j–l) SDPN-1-GFP labeled recycling endosomes are altered in the amph-1(tm1060) null mutant, appearing fewer and larger. Arrowheads indicate SDPN-1-GFP labeled structures. (l) Quantification of SDPN-1-GFP signal in the intestine of living wild-type and amph-1 mutant animals with respect to average number of labeled structures per unit area. The asterisk indicates a significant difference in the one-tailed Student’s T-test, p-value=2.4×10−06. For all the presented data, mean values were plotted on the graph and error bars represent ± s.d. from the mean. In all the experiments, n = 30 sampled fields (six animals of each genotype sampled in five different regions of each intestine). Scale bar represents 10 µm.
Figure 4
AMPH-1 function in endocytic recycling requires interaction with RME-1. AMPH-1(+) and interaction deficient AMPH-1(F309A, F363A) were expressed as mCherry fusions in amph_-1(tm1060)_ mutant intestines. AMPH-1(+) ( c) but not AMPH-1 (F309A, F363A) (d) could rescue the abnormal accumulation of recycling cargo hTfR-GFP in amph-1(tm1060) mutants. Synchronized adult worms were imaged by confocal microscopy. (e) Quantification of the hTfR-GFP labeled structures in the worms with respect to average number of labeled structures per unit area. The asterisk indicates a significant difference in the one-tailed Student’s T-test, p value for WT compared against amph-1(tm1060) = 9.7×10⁻²² and for WT compared with _amph-1(tm1060); AMPH-1(F309A, F363A)-mCherry_=9.4×10⁻²². For all the presented data mean values were plotted on the graph and error bars represent ± s.d. from the mean. In all the experiments, n = 30 sampled fields (six animals of each genotype sampled in five different regions of each intestine). Scale bar represents 10 µm.
Figure 5
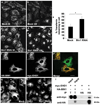
RNAi-mediated depletion of human Bin1 impairs Transferrin recycling and disrupts mRme-1/EHD1 positive recycling endosome tubules. Representative fields are shown for mock treated or Bin1 RNAi treated HeLa cells after 5 min Alexa-488 transferrin uptake (a, c) and 30 min chase (recycling) (b, d). The average total cell fluorescence was measured from confocal micrographs of 80 HeLa cells, mock treated or Bin1 RNAi treated, after Alexa-488 transferrin uptake followed by chase in complete medium for 30 min. (e) The data shown represents the mean of three independent experiments with n=80 cells per experimental condition. The mean values were plotted and error bars indicate ± s.e. from the mean value. The asterisk indicates a significant difference in the one-tailed Student’s T-test p value= 1.06 × 10⁻³⁵. (f-f’) Bin1 and mRme-1/EHD1 colocalize on intracellular tubules. HeLa cells transfected with 2×-HA-BIN1 isoform 10 and myc-EHD1 were visualized by confocal microscopy after immunostaining with primary antibodies (f) mouse anti-HA and (f’) rabbit anti-EHD1 followed by appropriate fluorochrome-labeled secondary antibodies. The insets and merged image (in panel f’’) demonstrate colocalization of HA-BIN1 isoform 10 with myc-EHD1 positive tubules. (g–h) mRme-1/EHD1 positive tubules are disrupted by Bin1 depletion. HeLa cells grown on coverslips were mock treated or subjected to Bin1 RNAi. Endogenous EHD1 was visualized by confocal microscopy after immunostaining with affinity-purified polyclonal rabbit anti-EHD1 antibody, followed by Alexa Fluor 488 anti-rabbit secondary antibodies. Note the loss of tubular EHD1 labeling after Bin1 depletion. Scale bar represents 10 µm. (i) mRme1/EHD1 physically associates with Bin1 isoform 10. HeLa cells were transfected with myc-EHD1 or co-transfected with myc-EHD1 and 2×-HA-Bin1 isoform 10. Cells were lysed and lysates were immunoprecipitated with goat anti-HA antibody-conjugated agarose beads. Unbound protein was removed by successive washes. Bound proteins were eluted with Laemmli sample buffer, separated by SDS-PAGE, and analyzed by western blot with anti-myc antibody. Input lane contains 1% of the lysate used in the binding assay.
Figure 6
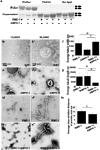
Membrane binding and tubulation by AMPH-1 and RME-1 in vitro. (a) Coomassie stained gels of supernatant and pellet fractions from liposome co-sedimentation assays are shown. Binding reactions were performed in the absence or presence of 0.33 mg/ml, 0.4 µm (average diameter) 100% Phosphatidylserine (PtdSer), or 100% Phosphatidylcholine (PtdChl) liposomes. Liposomes were incubated with 1mM ATP-γ-S and 1 µM of full length AMPH-1 or RME-1 proteins, or equimolar quantities of both proteins, as indicated. (b-e’) Electron micrographs of negatively stained PtdSer liposomes, prepared as above, but used at 0.05 mg/ml in the presence of 1mM ATP-γ-S with 2.5 µM proteins, GST (b-b’), AMPH-1 (c-c’), RME-1 (d-d’), or equimolar quantities of AMPH-1 and RME-1 (e-e’). (f) Quantification of tubule widths. For each experimental condition, width was measured for every tubule on each of 15 electron micrographs. For tubules demonstrating uneven width, an average measurement was made after taking measures at several representative points along the tubule. For n=15 representative tubules per experimental condition, the mean value for tubule width was plotted and error bars represent ± s.d. from the mean. The asterisk indicates a significant difference in the one-tailed Student’s T-test: RME-1 vs. RME-1+AMPH-1, p value= 0.0074 and for AMPH-1 vs. RME-1+AMPH-1, p value= 1.29 × 10⁻¹³. (g) Quantification of tubule lengths. The length from the edge of the liposome body to end of tubule was measured for every tubule on each of 15 electron micrographs per experimental condition. For n=15 representative tubules for each condition, the mean value for tubule length was plotted and error bars represent ± s.d. from the mean. The asterisk indicates a significant difference in the one-tailed Student’s T-test for tubule length: RME-1 vs. RME-1+AMPH-1, p value=1.2 × 10−07 and for AMPH-1 vs. RME-1+AMPH-1, p value= 3.2 × 10−04. (h) Quantification of inter-striation distance. For n=15 representative tubules, the average distance between every successive ring-like striation was counted for each experimental condition. Mean values were plotted and error bars represent ± standard deviation from the mean. The asterisk indicates a significant difference in the one-tailed Student’s T-test, p value=0.0031.
Figure 7
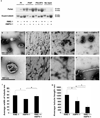
Membrane binding and tubulation by AMPH-1 and RME-1 in vitro with PI-[4,5]P2 liposomes. (a) Coomassie stained gels of supernatant and pellet fractions from liposome co-sedimentation assays are shown. Binding reactions were performed in the absence or presence of 0.33 mg/ml, 0.4 µm (average diameter) 80% Phosphatidylcholine (PtdChl), 10% Phosphatidylserine (PtdSer) and 10% of either unphosphorylated phosphatidylinositol (PI) or phosphatidylinositol-[4]-phosphate (PI-[4]-P) or phosphatidylinositol-[4,5]-bisphosphate (PI-[4, 5] P2) containing liposomes. Liposomes were incubated with 1mM ATP-γ-S and 1 µM of full length AMPH-1 or RME-1 proteins, or equimolar quantities of both proteins, as indicated. (b-e’) Electron micrographs of negatively stained PI-[4, 5]-P2 liposomes, prepared as above, but used at 0.05 mg/ml in the presence of 1mM ATP-γ-S with 2.5 µM proteins, GST (b-b’), RME-1-1 (c-c’), AMPH-1 (d-d’), or equimolar quantities of AMPH-1 and RME-1 (e-e’). Panels b–e represent 50, 000× magnification images while panels b’-e’ are enlarged regions from panels b–e respectively. (f) Quantification of tubule widths. For each experimental condition, width was measured for every tubule on each of 10 electron micrographs. For tubules demonstrating uneven width, an average measurement was made after taking measures at several representative points along the tubule. For n=10 representative tubules, the mean value for tubule width was plotted and error bars represent ± s.d. from the mean. The asterisk indicates a significant difference in the one-tailed Student’s T-test: RME-1 vs. AMPH-1, p value=0.01, RME-1 vs. RME-1+AMPH-1, p value= 0.29 and for AMPH-1 vs. RME-1+AMPH-1, p value= 0.004. (g) Quantification of tubule lengths. The length from the edge of the liposome body to end of tubule was measured for every tubule on each of 10 electron micrographs per experimental condition. For n=10 representative tubules for each experimental condition, the mean value of tubule length was plotted and error bars represent ± s.d. from the mean. The asterisk indicates a significant difference in the one-tailed Student’s T-test for tubule length: RME-1 vs. AMPH-1, p value= 0.005, RME-1 vs. RME-1+AMPH-1, p value=1.8 × 10−06 and for AMPH-1 vs. RME-1+AMPH-1, p value= 3.8 × 10−04.
Figure 8
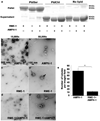
Nucleotide effects on RME-1 and AMPH-1 mediated liposome tubulation. (a) Coomassie stained gels of supernatant and pellet fractions from liposome co-sedimentation assays are shown. Binding reactions were performed in the absence or presence of 0.33 mg/ml, 0.4 µm (average diameter) 100% Phosphatidylserine (PtdSer), or 100% Phosphatidylcholine (PtdChl) liposomes. Liposomes were incubated with 1mM ADP and 1 µM of full length AMPH-1 or RME-1 proteins, or equimolar quantities of both proteins, as indicated. Note that RME-1 can bind to PtdSer liposomes in the presence of ADP. Tubulation experiments were performed with 2.5µM of each protein and 1mM ADP incubated with 0.05mg/ml 100% PtdSer liposomes. (b-b’) AMPH-1 incubated with PtdSer liposomes in the presence of ADP (compare with ATP-γ-S, Fig. 5 c-c’). (c-c’) RME-1 incubated with PtdSer liposomes in the presence of ADP (compare with ATP-γ-S, Fig. 5 d-d’). RME-1(ADP) lacks tubulation capacity and most liposomes remain spherical (open arrow) in the presence of RME-1(ADP). Striations are often visible and rare short protrusions (closed arrows) are present on occasional liposomes. (d-d’) RME-1 in its ADP bound state can affect the tubulation ability of AMPH-1 as observed in an experiment containing equimolar concentrations of both proteins in the presence of ADP. (e) Quantification reveals an approximately 7 fold decrease in number of tubules in conditions where RME-1 is present with AMPH-1, as compared to tubulation produced by AMPH-1 alone. n=10 fields for each experimental condition (imaged at 3,000× magnification), the mean value for number of observed tubules was plotted and error bars represent ± s.d. from the mean. The asterisk indicates a significant difference in the one-tailed Student’s T-test (p value=1.48×10⁻¹⁵).
Similar articles
- Shared as well as distinct roles of EHD proteins revealed by biochemical and functional comparisons in mammalian cells and C. elegans.
George M, Ying G, Rainey MA, Solomon A, Parikh PT, Gao Q, Band V, Band H. George M, et al. BMC Cell Biol. 2007 Jan 18;8:3. doi: 10.1186/1471-2121-8-3. BMC Cell Biol. 2007. PMID: 17233914 Free PMC article. - Basolateral Endocytic Recycling Requires RAB-10 and AMPH-1 Mediated Recruitment of RAB-5 GAP TBC-2 to Endosomes.
Liu O, Grant BD. Liu O, et al. PLoS Genet. 2015 Sep 22;11(9):e1005514. doi: 10.1371/journal.pgen.1005514. eCollection 2015. PLoS Genet. 2015. PMID: 26393361 Free PMC article. - A novel requirement for C. elegans Alix/ALX-1 in RME-1-mediated membrane transport.
Shi A, Pant S, Balklava Z, Chen CC, Figueroa V, Grant BD. Shi A, et al. Curr Biol. 2007 Nov 20;17(22):1913-24. doi: 10.1016/j.cub.2007.10.045. Epub 2007 Nov 8. Curr Biol. 2007. PMID: 17997305 Free PMC article. - Mechanisms of EHD/RME-1 protein function in endocytic transport.
Grant BD, Caplan S. Grant BD, et al. Traffic. 2008 Dec;9(12):2043-52. doi: 10.1111/j.1600-0854.2008.00834.x. Epub 2008 Oct 14. Traffic. 2008. PMID: 18801062 Free PMC article. Review. - Structural insights into the centronuclear myopathy-associated functions of BIN1 and dynamin 2.
Hohendahl A, Roux A, Galli V. Hohendahl A, et al. J Struct Biol. 2016 Oct;196(1):37-47. doi: 10.1016/j.jsb.2016.06.015. Epub 2016 Jun 23. J Struct Biol. 2016. PMID: 27343996 Free PMC article. Review.
Cited by
- Binding and repressive activities of apolipoprotein E3 and E4 isoforms on the human ApoD promoter.
Levros LC Jr, Labrie M, Charfi C, Rassart E. Levros LC Jr, et al. Mol Neurobiol. 2013 Dec;48(3):669-80. doi: 10.1007/s12035-013-8456-0. Epub 2013 May 30. Mol Neurobiol. 2013. PMID: 23715769 Free PMC article. - Entamoeba histolytica EHD1 Is Involved in Mitosome-Endosome Contact.
Santos HJ, Hanadate Y, Imai K, Watanabe H, Nozaki T. Santos HJ, et al. mBio. 2022 Apr 26;13(2):e0384921. doi: 10.1128/mbio.03849-21. Epub 2022 Apr 11. mBio. 2022. PMID: 35404118 Free PMC article. - Stem Cells as Potential Targets of Polyphenols in Multiple Sclerosis and Alzheimer's Disease.
Tandon A, Singh SJ, Chaturvedi RK. Tandon A, et al. Biomed Res Int. 2018 Jul 12;2018:1483791. doi: 10.1155/2018/1483791. eCollection 2018. Biomed Res Int. 2018. PMID: 30112360 Free PMC article. Review. - EHD proteins: key conductors of endocytic transport.
Naslavsky N, Caplan S. Naslavsky N, et al. Trends Cell Biol. 2011 Feb;21(2):122-31. doi: 10.1016/j.tcb.2010.10.003. Epub 2010 Nov 8. Trends Cell Biol. 2011. PMID: 21067929 Free PMC article. Review. - Positively correlated miRNA-mRNA regulatory networks in mouse frontal cortex during early stages of alcohol dependence.
Nunez YO, Truitt JM, Gorini G, Ponomareva ON, Blednov YA, Harris RA, Mayfield RD. Nunez YO, et al. BMC Genomics. 2013 Oct 22;14:725. doi: 10.1186/1471-2164-14-725. BMC Genomics. 2013. PMID: 24148570 Free PMC article.
References
- Grant B, et al. Evidence that RME-1, a conserved C. elegans EH-domain protein, functions in endocytic recycling. Nature cell biology. 2001;3:573–579. - PubMed
- Lin SX, Grant B, Hirsh D, Maxfield FR. Rme-1 regulates the distribution and function of the endocytic recycling compartment in mammalian cells. Nature cell biology. 2001;3:567–572. - PubMed
- Lee DW, et al. ATP binding regulates oligomerization and endosome association of RME-1 family proteins. The Journal of biological chemistry. 2005;280:17213–17220. - PubMed
Publication types
MeSH terms
Substances
Grants and funding
- R24 RR022234/RR/NCRR NIH HHS/United States
- R24RR22234/RR/NCRR NIH HHS/United States
- GM67237/GM/NIGMS NIH HHS/United States
- R01 GM067237/GM/NIGMS NIH HHS/United States
- R01 GM067237-07/GM/NIGMS NIH HHS/United States
- R01 GM074876/GM/NIGMS NIH HHS/United States
- GM074876/GM/NIGMS NIH HHS/United States
LinkOut - more resources
Full Text Sources
Other Literature Sources
Molecular Biology Databases
Research Materials
Miscellaneous
