Discovery and annotation of functional chromatin signatures in the human genome - PubMed (original) (raw)
Discovery and annotation of functional chromatin signatures in the human genome
Gary Hon et al. PLoS Comput Biol. 2009 Nov.
Abstract
Transcriptional regulation in human cells is a complex process involving a multitude of regulatory elements encoded by the genome. Recent studies have shown that distinct chromatin signatures mark a variety of functional genomic elements and that subtle variations of these signatures mark elements with different functions. To identify novel chromatin signatures in the human genome, we apply a de novo pattern-finding algorithm to genome-wide maps of histone modifications. We recover previously known chromatin signatures associated with promoters and enhancers. We also observe several chromatin signatures with strong enrichment of H3K36me3 marking exons. Closer examination reveals that H3K36me3 is found on well-positioned nucleosomes at exon 5' ends, and that this modification is a global mark of exon expression that also correlates with alternative splicing. Additionally, we observe strong enrichment of H2BK5me1 and H4K20me1 at highly expressed exons near the 5' end, in contrast to the opposite distribution of H3K36me3-marked exons. Finally, we also recover frequently occurring chromatin signatures displaying enrichment of repressive histone modifications. These signatures mark distinct repeat sequences and are associated with distinct modes of gene repression. Together, these results highlight the rich information embedded in the human epigenome and underscore its value in studying gene regulation.
Conflict of interest statement
The authors have declared that no competing interests exist.
Figures
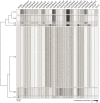
Figure 1. Distinct chromatin signatures spanning Refseq promoters.
(left) Applying ChromaSig to the histone modifications near 20,389 Refseq promoters recovers 14 frequently-occurring chromatin signatures spanning 18,533 promoters. The heat map represents the enrichment of H2AZ, 20 histone modifications, CTCF, and RNA polymerase II in the 10-kb region surrounding each promoter. To organize these clusters visually, we performed hierarchical clustering on the average profiles using a Pearson correlation distance metric. (right) Gene expression data for CD4+ T cells measured from a previous study , and re-visualized here for the different classes of promoters. Shown are the distributions of gene expression level over promoters with different chromatin signatures. Red horizontal lines indicate the median, the box extends to the lower and upper quartiles, the whiskers extend to 1.5 times the inter-quartile range, and red “+” symbols are outliers.
Figure 2. Distinct chromatin signatures spanning genomic loci distal to known regulatory elements.
We identified 50,183 genomic loci with strong ChIP enrichment of histone modifications but distal to promoters, gene 3′ ends, DNase I hypersensitive sites, CTCF binding sites, and predicted enhancers. Applying ChromaSig to these loci reveals seven clusters U1–7 spanning 47,874 loci. The heat map represents the enrichment of H2AZ, 20 histone modifications, CTCF, and RNA polymerase II in the 10-kb region surrounding each locus. To organize these clusters visually, we performed hierarchical clustering on the average profiles of each ChromaSig cluster, using a Pearson correlation distance metric (left).
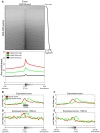
Figure 3. H3K36me3 marks exon 5′ ends and is a global mark of expression.
(A) The top panel is a heat map of H3K36me3 enrichment at all human exons, sorted by exonic expression (right). The bottom panel is the average H3K36me3 enrichment profile of the lowest, middle, and highest third of expressed exons from the top panel. The distribution of H3K36me3 reads within ±500 bp of exon (B) 5′ ends and (C) 3′ ends of the top 50% expressed exons in the human genome. In red are reads on the sense strand in the direction of transcription, and in green are anti-sense reads. A schematic of a positioned a nucleosome is shown. (D–E) As in (B–C), but focusing on expressed exons longer than 500 bp.
Figure 4. H3K36me3 enrichment correlates with alternative splicing.
The number of H3K36me3 reads per kilobase for exons near alternatively spliced cassette exons that are (A) spliced in or (B) spliced out. A cassette exon is defined to be spliced in if the difference in expression between it and its immediate upstream and downstream exons is less than 0.5 on a log2 scale. A cassette exon is defined to be spliced out if both upstream and downstream exons are at least 2-fold more expressed (1.0 on a log2 scale).
Figure 5. H2BK5me1 and H4K20me1 mark early exons.
(A) Shown is a heat-map representing the enrichment of various modifications and factors in a 5-kb region surrounding the top third expressed exons. The exons are separated into (top) first exons and (bottom) non-first exons, and are then sorted by distance from the transcription start site. Non-first exons are further subcategorized into early, middle, and late exons. (B) The average profiles for (left) H2BK5me1, (middle) H3K36me3, and (right) H4K20me1 for first, early, middle, and late exons.
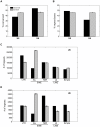
Figure 6. U5 and U6 mark distinct sequences of the genome.
(A) The percentage of loci in U5 and U6 within 1-kb to an evolutionarily conserved PhastCons element. (B) The average percentage of bases ±1 kb around each locus that are masked by RepeatMasker. (C–D) The number of repeat elements within ±1 kb of each locus in (C) U5 and (D) U6. Black indicates the observed value while grey indicates the expected value over random sites. The error bars indicate ±1 standard deviation. LTR, long terminal repeat; simple, simple repeat.
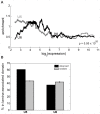
Figure 7. U5 and U6 mark distinct expression domains of the genome.
(A) Enrichment of U5 and U6 loci as a function of expression for genes in the same domain. We counted the number of U5 and U6 loci within the CTCF-defined domains containing human promoters, assessed enrichment as compared to that expected over random sites, and averaged over a 1000-promoter sliding window to create each profile. The signed rank p-value is indicated. (B) The percentage each cluster within lamina-associated domains, previously mapped in Tig3 human lung fibroblasts (black), as compared to random sites (grey). The error bars indicate ±1 standard deviation.
Similar articles
- ChromaSig: a probabilistic approach to finding common chromatin signatures in the human genome.
Hon G, Ren B, Wang W. Hon G, et al. PLoS Comput Biol. 2008 Oct;4(10):e1000201. doi: 10.1371/journal.pcbi.1000201. Epub 2008 Oct 17. PLoS Comput Biol. 2008. PMID: 18927605 Free PMC article. - Contrasting chromatin organization of CpG islands and exons in the human genome.
Choi JK. Choi JK. Genome Biol. 2010;11(7):R70. doi: 10.1186/gb-2010-11-7-r70. Epub 2010 Jul 5. Genome Biol. 2010. PMID: 20602769 Free PMC article. - Distinct and predictive chromatin signatures of transcriptional promoters and enhancers in the human genome.
Heintzman ND, Stuart RK, Hon G, Fu Y, Ching CW, Hawkins RD, Barrera LO, Van Calcar S, Qu C, Ching KA, Wang W, Weng Z, Green RD, Crawford GE, Ren B. Heintzman ND, et al. Nat Genet. 2007 Mar;39(3):311-8. doi: 10.1038/ng1966. Epub 2007 Feb 4. Nat Genet. 2007. PMID: 17277777 - Toward a comprehensive catalog of regulatory elements.
Fan K, Pfister E, Weng Z. Fan K, et al. Hum Genet. 2023 Aug;142(8):1091-1111. doi: 10.1007/s00439-023-02519-3. Epub 2023 Mar 19. Hum Genet. 2023. PMID: 36935423 Review. - Transcriptional Silencers: Driving Gene Expression with the Brakes On.
Segert JA, Gisselbrecht SS, Bulyk ML. Segert JA, et al. Trends Genet. 2021 Jun;37(6):514-527. doi: 10.1016/j.tig.2021.02.002. Epub 2021 Mar 9. Trends Genet. 2021. PMID: 33712326 Free PMC article. Review.
Cited by
- Detecting splicing variants in idiopathic pulmonary fibrosis from non-differentially expressed genes.
Deng N, Sanchez CG, Lasky JA, Zhu D. Deng N, et al. PLoS One. 2013 Jul 2;8(7):e68352. doi: 10.1371/journal.pone.0068352. Print 2013. PLoS One. 2013. PMID: 23844188 Free PMC article. - Differential roles for MBD2 and MBD3 at methylated CpG islands, active promoters and binding to exon sequences.
Günther K, Rust M, Leers J, Boettger T, Scharfe M, Jarek M, Bartkuhn M, Renkawitz R. Günther K, et al. Nucleic Acids Res. 2013 Mar 1;41(5):3010-21. doi: 10.1093/nar/gkt035. Epub 2013 Jan 29. Nucleic Acids Res. 2013. PMID: 23361464 Free PMC article. - Dynamic integration of splicing within gene regulatory pathways.
Braunschweig U, Gueroussov S, Plocik AM, Graveley BR, Blencowe BJ. Braunschweig U, et al. Cell. 2013 Mar 14;152(6):1252-69. doi: 10.1016/j.cell.2013.02.034. Cell. 2013. PMID: 23498935 Free PMC article. Review. - Architectural and Functional Commonalities between Enhancers and Promoters.
Kim TK, Shiekhattar R. Kim TK, et al. Cell. 2015 Aug 27;162(5):948-59. doi: 10.1016/j.cell.2015.08.008. Cell. 2015. PMID: 26317464 Free PMC article. Review. - Pre-mRNA splicing during transcription in the mammalian system.
Pandya-Jones A. Pandya-Jones A. Wiley Interdiscip Rev RNA. 2011 Sep-Oct;2(5):700-17. doi: 10.1002/wrna.86. Epub 2011 May 2. Wiley Interdiscip Rev RNA. 2011. PMID: 21823230 Free PMC article. Review.
References
- Maston GA, Evans SK, Green MR. Transcriptional Regulatory Elements in the Human Genome. Annu Rev Genomics Hum Genet. 2006;7:29–59. - PubMed
- Kouzarides T. Chromatin modifications and their function. Cell. 2007;128:693–705. - PubMed
- Bernstein BE, Mikkelsen TS, Xie X, Kamal M, Huebert DJ, et al. A Bivalent Chromatin Structure Marks Key Developmental Genes in Embryonic Stem Cells. Cell. 2006;125:12. - PubMed
Publication types
MeSH terms
Substances
LinkOut - more resources
Full Text Sources
Other Literature Sources


