Investigating the functional heterogeneity of the default mode network using coordinate-based meta-analytic modeling - PubMed (original) (raw)
Investigating the functional heterogeneity of the default mode network using coordinate-based meta-analytic modeling
Angela R Laird et al. J Neurosci. 2009.
Abstract
The default mode network (DMN) comprises a set of regions that exhibit ongoing, intrinsic activity in the resting state and task-related decreases in activity across a range of paradigms. However, DMN regions have also been reported as task-related increases, either independently or coactivated with other regions in the network. Cognitive subtractions and the use of low-level baseline conditions have generally masked the functional nature of these regions. Using a combination of activation likelihood estimation, which assesses statistically significant convergence of neuroimaging results, and tools distributed with the BrainMap database, we identified core regions in the DMN and examined their functional heterogeneity. Meta-analytic coactivation maps of task-related increases were independently generated for each region, which included both within-DMN and non-DMN connections. Their functional properties were assessed using behavioral domain metadata in BrainMap. These results were integrated to determine a DMN connectivity model that represents the patterns of interactions observed in task-related increases in activity across diverse tasks. Subnetwork components of this model were identified, and behavioral domain analysis of these cliques yielded discrete functional properties, demonstrating that components of the DMN are differentially specialized. Affective and perceptual cliques of the DMN were identified, as well as the cliques associated with a reduced preference for motor processing. In summary, we used advanced coordinate-based meta-analysis techniques to explicate behavior and connectivity in the default mode network; future work will involve applying this analysis strategy to other modes of brain function, such as executive function or sensorimotor systems.
Figures
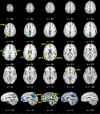
Figure 1.
Meta-analytic identification of regions in the DMN (p < 0.005, corrected). These results were used to define ROIs for the BD profile analyses and MACM. z values for each axial slice are reported in Talairach space (top panel), while x values denote sagittal slices (bottom panel).
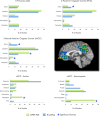
Figure 2.
Behavioral Domain Profiles for the Top 3 Highly Concordant DMN Regions. BrainMap counts (blue histograms) represent values observed across the entire database, while DMN ROIs (green histograms) were restricted to the nodes defined in Figure 1. All values are normalized. A complete listing of significant domains for all regions is reported in Figure 3.
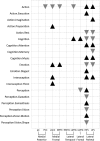
Figure 3.
Behavioral domain profiles for individual DMN regions. Significant behavioral domains are listed for each region in the default mode network. Black upward triangles indicate domains in which the observed regional number of experiments was higher than expected compared with the distribution across the BrainMap database, while gray downward triangles indicate domains that were lower than expected. The entire set of domains tested is available at
.
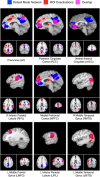
Figure 4.
Composite image of the deactivations meta-analysis (blue) and MACM maps for each DMN region (red). Substantial overlap was observed for some regions (e.g., PCC and RMTG), while other regions showed minimal overlap (e.g., RIPL and vACC).
Figure 5.
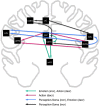
Meta-analytic model of connectivity between DMN regions. MACM overlap between ROIs observed in Figure 4 was used to construct a model representing connectivity between regions. Directionality of paths indicates that an ROI was observed (ending point) in another ROIs MACM (starting point). Color-coding of cliques in the model was determined by BD analysis of sets of nodes comprising these subnetworks.
Figure 6.
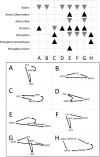
Behavioral domain profiles for DMN subnetworks. Significant behavioral domains are listed for each DMN subnetwork. Black upward triangles indicate clique domain counts that were higher than expected as compared across the BrainMap database, while gray downward triangles indicate lower than expected domains. A–G depict each of the subnetworks identified in the analysis of DMN coactivations, extracted from the observed connections in Figure 5. A and B are subnetworks composed of 3 nodes, constrained by the direction of paths in the model; C and D include 3 nodes unconstrained by path direction; E includes 4 constrained nodes; F includes 4 unconstrained nodes; G includes 5 constrained nodes; and H includes 5 unconstrained nodes.
Similar articles
- Weak task synchronization of default mode network in task based paradigms.
Tripathi V, Garg R. Tripathi V, et al. Neuroimage. 2022 May 1;251:118940. doi: 10.1016/j.neuroimage.2022.118940. Epub 2022 Feb 2. Neuroimage. 2022. PMID: 35121184 - Modulation of effective connectivity in the default mode network at rest and during a memory task.
Li X, Kehoe EG, McGinnity TM, Coyle D, Bokde AL. Li X, et al. Brain Connect. 2015 Feb;5(1):60-7. doi: 10.1089/brain.2014.0249. Epub 2014 Dec 29. Brain Connect. 2015. PMID: 25390185 - Networks of task co-activations.
Laird AR, Eickhoff SB, Rottschy C, Bzdok D, Ray KL, Fox PT. Laird AR, et al. Neuroimage. 2013 Oct 15;80:505-14. doi: 10.1016/j.neuroimage.2013.04.073. Epub 2013 Apr 28. Neuroimage. 2013. PMID: 23631994 Free PMC article. Review. - Heterogeneous fractionation profiles of meta-analytic coactivation networks.
Laird AR, Riedel MC, Okoe M, Jianu R, Ray KL, Eickhoff SB, Smith SM, Fox PT, Sutherland MT. Laird AR, et al. Neuroimage. 2017 Apr 1;149:424-435. doi: 10.1016/j.neuroimage.2016.12.037. Epub 2017 Feb 20. Neuroimage. 2017. PMID: 28222386 Free PMC article. - Default mode of brain function in monkeys.
Mantini D, Gerits A, Nelissen K, Durand JB, Joly O, Simone L, Sawamura H, Wardak C, Orban GA, Buckner RL, Vanduffel W. Mantini D, et al. J Neurosci. 2011 Sep 7;31(36):12954-62. doi: 10.1523/JNEUROSCI.2318-11.2011. J Neurosci. 2011. PMID: 21900574 Free PMC article. Review.
Cited by
- Abnormal resting-state functional connectivity of hippocampal subregions in type 2 diabetes mellitus-associated cognitive decline.
Yao L, Li MY, Wang KC, Liu YZ, Zheng HZ, Zhong Z, Ma SQ, Yang HM, Sun MM, He M, Huang HP, Wang HF. Yao L, et al. Front Psychiatry. 2024 Sep 23;15:1360623. doi: 10.3389/fpsyt.2024.1360623. eCollection 2024. Front Psychiatry. 2024. PMID: 39376966 Free PMC article. - Changes in Spatiotemporal Dynamics of Default Network Oscillations between 19 and 29 Years of Age.
Fehr T, Mehrens S, Haag MC, Amelung A, Gloy K. Fehr T, et al. Brain Sci. 2024 Jun 30;14(7):671. doi: 10.3390/brainsci14070671. Brain Sci. 2024. PMID: 39061412 Free PMC article. - Coordinate-Based Meta-Analyses of the Time Perception Network.
Wiener M. Wiener M. Adv Exp Med Biol. 2024;1455:215-226. doi: 10.1007/978-3-031-60183-5_12. Adv Exp Med Biol. 2024. PMID: 38918354 Review. - The subcortical default mode network and Alzheimer's disease: a systematic review and meta-analysis.
Seoane S, van den Heuvel M, Acebes Á, Janssen N. Seoane S, et al. Brain Commun. 2024 Apr 10;6(2):fcae128. doi: 10.1093/braincomms/fcae128. eCollection 2024. Brain Commun. 2024. PMID: 38665961 Free PMC article. - Resting-state brain network connectivity is an independent predictor of responsiveness to language therapy in chronic post-stroke aphasia.
Falconer I, Varkanitsa M, Kiran S. Falconer I, et al. Cortex. 2024 Apr;173:296-312. doi: 10.1016/j.cortex.2023.11.022. Epub 2024 Feb 13. Cortex. 2024. PMID: 38447266
References
- Andreasen NC, O'Leary DS, Cizadlo T, Arndt S, Rezai K, Watkins GL, Ponto LL, Hichwa RD. Remembering the past: Two facets of episodic memory explored with positron emission tomography. Am J Psychiatry. 1995;152:1576–1585. - PubMed
- Binder JR, Frost JA, Hammeke TA, Bellgowan PSF, Rao SM, Cox RW. Conceptual processing during the conscious resting state: a functional MRI study. J Cogn Neurosci. 1999;11:80–93. - PubMed
- Biswal B, Yetkin FZ, Haughton VM, Hyde JS. Functional connectivity in the motor cortex of resting human brain using echo-planar MRI. Magn Reson Med. 1995;34:537–541. - PubMed
- Broyd SJ, Demanuele C, Debener S, Helps SK, James CJ, Sonuga-Barke EJ. Default-mode brain dysfunction in mental disorders: A systematic review. Neurosci Biobehav Rev. 2009;33:279–296. - PubMed
Publication types
MeSH terms
Grants and funding
- R01 MH084812-01A1/MH/NIMH NIH HHS/United States
- R01-MH084812/MH/NIMH NIH HHS/United States
- R01 MH074457/MH/NIMH NIH HHS/United States
- R01-MH074457/MH/NIMH NIH HHS/United States
- R01 MH084812/MH/NIMH NIH HHS/United States
- R01 MH074457-04/MH/NIMH NIH HHS/United States
LinkOut - more resources
Full Text Sources
