mTOR regulation and therapeutic rejuvenation of aging hematopoietic stem cells - PubMed (original) (raw)
mTOR regulation and therapeutic rejuvenation of aging hematopoietic stem cells
Chong Chen et al. Sci Signal. 2009.
Abstract
Age-related declines in hematopoietic stem cell (HSC) function may contribute to anemia, poor response to vaccination, and tumorigenesis. Here, we show that mammalian target of rapamycin (mTOR) activity is increased in HSCs from old mice compared to those from young mice. mTOR activation through conditional deletion of Tsc1 in the HSCs of young mice mimicked the phenotype of HSCs from aged mice in various ways. These included increased abundance of the messenger RNA encoding the CDK inhibitors p16(Ink4a), p19(Arf), and p21(Cip1); a relative decrease in lymphopoiesis; and impaired capacity to reconstitute the hematopoietic system. In old mice, rapamycin increased life span, restored the self-renewal and hematopoiesis of HSCs, and enabled effective vaccination against a lethal challenge with influenza virus. Together, our data implicate mTOR signaling in HSC aging and show the potential of mTOR inhibitors for restoring hematopoiesis in the elderly.
Figures
Fig. 1
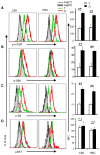
mTOR activity in young and aged HSCs. Fresh BM cells were isolated from either 2-month (young) or 26-month (old) old wildtype mice and stained with antibodies specific for surface markers to identify the Flk2− lin− Sca-1+c-kit+ CD150+CD48− CD34− (FLSKCD150/48/34) HSC or the
HSC-enriched
lin− Sca-1+c-kit+ (LSK) cells, followed by intracellular staining with antibodies against p-mTOR (A), p-S6K (B), p-S6 (C) and p-AKT (D). The left panels show the histograms of HSC that are representative of 5 independent experiments each involving one mouse per group. Gray lines are negative controls (secondary antibodies only for a, b and d, isotype control for c), with filled grey depicting cells from old mice, while dotted lines depicting cells from young mice; green lines depict profiles of stained BM cells from young mice and red lines depict those of BM cells from old mice. The maximum depicts the point with highest cell count. The mean fluorescence intensity (MFI) ± SD of all experiments are shown in the right panels. *, p<0.05; **, p<0.01. n.s., not significant.
Fig. 2
Tsc1 deficiency and premature aging of HSC from young mice. A. six week old Tsc1flox/flox (WT) and Tsc1flox/flox; Mx1-cre+ (KO) mice were treated 7 times with pIpC every other day for 14 days and sacrificed 10 days after the last treatment. The abundance of p16Ink4a, p19Arf, and p21Cip1 mRNAs in FACS-sorted HSCs was measured by real-time PCR and normalized to hypoxanthine-guanine phosphoribosyltransferase (Hprt). n=5. B–E. 50 HSCs were mixed with 2×10⁵ recipient-type total BM cells (WBM) and transplanted into lethally irradiated B6Ly5.2 recipients. The donor and recipient-type cells were identified by congenic CD45 markers. B. Diagram of the experimental design for C–D. C. Hematopoiesis by WT and _Tsc1_−/− HSCs. Left shown the representative dot plots of the recipient peripheral blood at 16-weeks after transplantation with WT (top) or Tsc1−/− cells (bottom). Data on the right summarize two independent experiments with a total of 10 recipients for each group. D. The percent of the donor HSC-derived and B220+ (B) and Mac-1+ (M) cells in the recipient peripheral blood at 4 weeks after transplantation. E. The percentage of B and M cells in total white blood cells.
Fig. 3
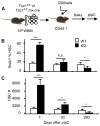
Targeted mutation of Tsc1 in bone marrow cells resulted in transient increase but long-term reduction in HSC self-renewal. A. The diagram of experimental design. B. BrdU incorporation of HSCs from WT- or KO- donors after 24h labeling. n=4. C. HSC numbers derived from WT- or KO- donors in the recipients after pIpC treatment. n=4.
Fig. 4
Effect of rapamycin on life span of old mice. Age-matched 22–24 month old B6 mice were treated with vehicle or 4mg/kg bodyweight rapamycin by intraperitoneal injection every other day for 6 weeks. Survival of mice following the first rapamycin treatment were monitored on daily basis.
Death ratio refers to fraction of mice that are either dead or moribund
, n=10.
Fig. 5
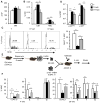
Rapamycin rejuvenates HSC from old mice. A. Bone marrow cellularity of tibia and femurs of young (Y, 2 months of age) mice, or age-matched, 22–24 months old mice treated with either vehicle (O-veh) or old mice treated with rapamycin (O-rapa). n=5. B. The percentage of LSK and FLSKCD150/48/34 HSC populations in bone marrow of Y, O-veh and O-rapa mice. n=5. C. BrdU incorporation. Left panels show representative profiles of BrdU incorporation in HSCs, and right panels show Mean ± SD of BrdU+ cells (n=4). D. HSCs were sorted by FACS and p16Ink4a and p19Arf mRNA abundance was measured by real-time PCR and normalized to Hprt abundance; values shown are mean ± SD (n=3). E. Diagram of experiments. F. Hematopoietic function of HSC as measured by CD45 congenic markers on leukocytes of recipient peripheral blood at 4 weeks and 28 weeks after transplantation. The left panels show the % of donor-type cells among leukocytes (CD45+) and right panels show the reconstitution rates of B220+ (B), CD3+ (T) and Mac-1+ (M) lineages. Data shown were from three independent experiments with 15 recipients per group.
Fig. 6
Vaccination-induced protection in old mice after vehicle or rapamycin treatment. a–c, 22–24 month old B6 mice were treated with vehicle or 4mg/kg body weight rapamycin by intraperitoneal injection every other day for 6 weeks. A. Representative FACS files of BM cells from young (Y) and old mice treated with either vehicle (O-veh) or rapamycin (O-rapa). n=5. B. The percentage of immature B progenitor cells (B220lowIgM−) in whole bone marrow, gated as in (A). C. The percentage (left panel) and absolute number (right panel) of B220+ B lineage cells and Mac-1+ myeloid lineage cells in whole bone marrow. D–F, 26–28 month old B6 mice were treated with vehicle or 4mg/kg body weight rapamycin by intraperitoneal injection every other day for 6 weeks. Two weeks later, young and vehicle- or rapamycin-treated old mice were immunized with 200 HAU of A/PR/8/34 virus by i.p. injection. D. The diagram of experimental design for e–f. E. 10 days after immunization, influenza-specific antibodies in the plasma of peripheral blood were measured by ELISA. F. Two-weeks after immunization, mice were challenged with 400 HAU of A/PR/8/34 virus by intranasal delivery. Data shown are Kaplan-Meier survival analysis. n=12. The P value is derived from a log-rank test.
Similar articles
- Rapamycin enhances long-term hematopoietic reconstitution of ex vivo expanded mouse hematopoietic stem cells by inhibiting senescence.
Luo Y, Li L, Zou P, Wang J, Shao L, Zhou D, Liu L. Luo Y, et al. Transplantation. 2014 Jan 15;97(1):20-9. doi: 10.1097/TP.0b013e3182a7fcf8. Transplantation. 2014. PMID: 24092377 Free PMC article. - [Mechanism of hematopoietic stem/progenitor cell aging induced by radiation damage].
Zhang C, Sun K, Geng S, Liu D, Zhang X, Liu J, Xu C, Wang J, Wang Y. Zhang C, et al. Xi Bao Yu Fen Zi Mian Yi Xue Za Zhi. 2013 Mar;29(3):233-6. Xi Bao Yu Fen Zi Mian Yi Xue Za Zhi. 2013. PMID: 23643076 Chinese. - Hhex Regulates Hematopoietic Stem Cell Self-Renewal and Stress Hematopoiesis via Repression of Cdkn2a.
Jackson JT, Shields BJ, Shi W, Di Rago L, Metcalf D, Nicola NA, McCormack MP. Jackson JT, et al. Stem Cells. 2017 Aug;35(8):1948-1957. doi: 10.1002/stem.2648. Epub 2017 Jun 19. Stem Cells. 2017. PMID: 28577303 - Role of the mammalian target of rapamycin pathway in lentiviral vector transduction of hematopoietic stem cells.
Wang CX, Torbett BE. Wang CX, et al. Curr Opin Hematol. 2015 Jul;22(4):302-8. doi: 10.1097/MOH.0000000000000150. Curr Opin Hematol. 2015. PMID: 26049750 Free PMC article. Review. - The Akt-mTOR network at the interface of hematopoietic stem cell homeostasis.
Wu F, Chen Z, Liu J, Hou Y. Wu F, et al. Exp Hematol. 2021 Nov;103:15-23. doi: 10.1016/j.exphem.2021.08.009. Epub 2021 Aug 28. Exp Hematol. 2021. PMID: 34464661 Review.
Cited by
- Inhibition of the Mechanistic Target of Rapamycin (mTOR)-Rapamycin and Beyond.
Lamming DW. Lamming DW. Cold Spring Harb Perspect Med. 2016 May 2;6(5):a025924. doi: 10.1101/cshperspect.a025924. Cold Spring Harb Perspect Med. 2016. PMID: 27048303 Free PMC article. Review. - Deep Proteome Analysis Identifies Age-Related Processes in C. elegans.
Narayan V, Ly T, Pourkarimi E, Murillo AB, Gartner A, Lamond AI, Kenyon C. Narayan V, et al. Cell Syst. 2016 Aug;3(2):144-159. doi: 10.1016/j.cels.2016.06.011. Epub 2016 Jul 21. Cell Syst. 2016. PMID: 27453442 Free PMC article. - Finding Ponce de Leon's Pill: Challenges in Screening for Anti-Aging Molecules.
Kumar S, Lombard DB. Kumar S, et al. F1000Res. 2016 Mar 29;5:F1000 Faculty Rev-406. doi: 10.12688/f1000research.7821.1. eCollection 2016. F1000Res. 2016. PMID: 27081480 Free PMC article. Review. - Aging research using the common marmoset: Focus on aging interventions.
Ross CN, Salmon AB. Ross CN, et al. Nutr Healthy Aging. 2019;5(2):97-109. doi: 10.3233/nha-180046. Epub 2019 Sep 24. Nutr Healthy Aging. 2019. PMID: 33817407 Free PMC article. - How can aging be reversed? Exploring rejuvenation from a damage-based perspective.
Zhang B, Gladyshev VN. Zhang B, et al. Adv Genet (Hoboken). 2020 Aug 10;1(1):e10025. doi: 10.1002/ggn2.10025. eCollection 2020 Dec. Adv Genet (Hoboken). 2020. PMID: 36619246 Free PMC article.
References
- Weissman IL. Stem cells: Units of development, units of regeneration, and units in evolution. Cell. 2000 Jan 7;100:157–168. - PubMed
- Linton PJ, Dorshkind K. Age-related changes in lymphocyte development and function. Nat Immunol. 2004 Feb;5:133–139. - PubMed
MeSH terms
Substances
LinkOut - more resources
Full Text Sources
Other Literature Sources
Medical
Molecular Biology Databases
Miscellaneous


