Direct regulation of myocardial triglyceride metabolism by the cardiomyocyte circadian clock - PubMed (original) (raw)
. 2010 Jan 29;285(5):2918-29.
doi: 10.1074/jbc.M109.077800. Epub 2009 Nov 25.
Petra C Kienesberger, Thomas Pulinilkunnil, Mary H Sailors, David J Durgan, Carolina Villegas-Montoya, Anil Jahoor, Raquel Gonzalez, Merissa E Garvey, Brandon Boland, Zachary Blasier, Tracy A McElfresh, Vijayalakshmi Nannegari, Chi-Wing Chow, William C Heird, Margaret P Chandler, Jason R B Dyck, Molly S Bray, Martin E Young
Affiliations
- PMID: 19940111
- PMCID: PMC2823428
- DOI: 10.1074/jbc.M109.077800
Direct regulation of myocardial triglyceride metabolism by the cardiomyocyte circadian clock
Ju-Yun Tsai et al. J Biol Chem. 2010.
Abstract
Maintenance of circadian alignment between an organism and its environment is essential to ensure metabolic homeostasis. Synchrony is achieved by cell autonomous circadian clocks. Despite a growing appreciation of the integral relation between clocks and metabolism, little is known regarding the direct influence of a peripheral clock on cellular responses to fatty acids. To address this important issue, we utilized a genetic model of disrupted clock function specifically in cardiomyocytes in vivo (termed cardiomyocyte clock mutant (CCM)). CCM mice exhibited altered myocardial response to chronic high fat feeding at the levels of the transcriptome and lipidome as well as metabolic fluxes, providing evidence that the cardiomyocyte clock regulates myocardial triglyceride metabolism. Time-of-day-dependent oscillations in myocardial triglyceride levels, net triglyceride synthesis, and lipolysis were markedly attenuated in CCM hearts. Analysis of key proteins influencing triglyceride turnover suggest that the cardiomyocyte clock inactivates hormone-sensitive lipase during the active/awake phase both at transcriptional and post-translational (via AMP-activated protein kinase) levels. Consistent with increased net triglyceride synthesis during the end of the active/awake phase, high fat feeding at this time resulted in marked cardiac steatosis. These data provide evidence for direct regulation of triglyceride turnover by a peripheral clock and reveal a potential mechanistic explanation for accelerated metabolic pathologies after prevalent circadian misalignment in Western society.
Figures
FIGURE 1.
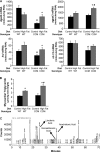
High fat feeding-induced effects on metabolic gene expression (A), myocardial triglyceride (B), and distinct lipid species (C) were altered in CCM hearts. After 16 weeks of diet intervention, gene expression analyses of dgat2, agpat3, hsl, and s3-12 (A) were performed using quantitative RT-PCR in WT and CCM hearts isolated at ZT18. Myocardial triglyceride levels (B) were also measured. Lipid species were analyzed by gas chromatography after methyl esterification (C). Arachidonic acid, eicosatrienoic acid, and linolenic acid are indicated in the represented spectrum (C). Data are represented as the mean ± S.E. Statistical analysis was performed using a two-way ANOVA followed by a post hoc comparison with Bonferroni correction. * denotes control versus high fat diet within a genotype; # denotes p < 0.05 WT versus CCM within a feeding group (n = 13–19 for gene expression and n = 6 for myocardial triglyceride and lipididomic profiling).
FIGURE 2.
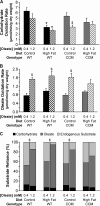
High fat feeding-induced responses in myocardial carbohydrate oxidation rate (A), oleate oxidation rate (B), and substrate reliance (C). After 16 weeks of diet intervention, carbohydrate oxidation rate (A), oleate oxidation rate (B), and substrate reliance (C) were measured in WT and CCM hearts, isolated at ZT18, and perfused ex vivo in the working mode initially with 0.4 m
m
for 30 min and subsequently with 1.2 m
m
oleate for 30 min. [U-14C]Glucose (0.096 mCi/liter) and [U-14C]lactic acid (0.009 mCi/liter) were included in the perfusion buffer to determine carbohydrate oxidation rate and reliance. [9,10-3H]Oleate (0.067 mCi/liter) was included in the perfusion buffer to determine oleate oxidation rate and reliance. Data are represented as the mean ± S.E. Statistical analysis was performed using a three-way ANOVA followed by a post hoc comparison with Bonferroni correction. * denotes control versus high fat diet within a genotype; # denotes p < 0.05 WT versus CCM within a feeding group; $ denotes p < 0.05 0.4 m
m
oleate versus 1.2 m
m
oleate within a genotype and feeding group (n = 5–8).
FIGURE 3.
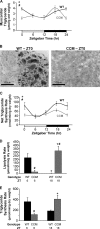
Diurnal variations in myocardial triglyceride levels (A and B), net triglyceride synthesis rate (C), lipolysis rate (D), and triglyceride synthesis rate (E) in WT hearts were altered in CCM hearts. Myocardial triglyceride levels (A) were measured in WT and CCM hearts isolated at ZT 0, 6, 12, and 18. Oil red O staining (B) was performed on frozen sections from WT and CCM hearts isolated at ZT0. The black bar denotes 100 μm. Net incorporation of [3H]oleate into triglyceride (C) was measured in ex vivo perfused WT and CCM hearts isolated at ZT0, 6, 12, and 18; after the 40-min perfusion with buffer containing [9,10-3H]oleate (0.067 mCi/liter), the hearts were freeze-clamped and stored until analysis. Myocardial lipolysis (D) and triglyceride synthesis (E) were determined in ex vivo perfused WT and CCM hearts isolated at ZT6 and ZT18 using a pulse-chase method. The hearts were initially pulsed with 1.2 m
m
oleate and tracer amounts of [1-14C]oleate (0.12 mCi/liter) for 1 h followed by a 15-min wash with nonradioactive buffer and subsequently chased with buffer containing 0.4 m
m
oleate and tracer amounts of [9,10-3H]oleate (0.067 mCi/liter) for an additional 45 min. Data are represented as the mean ± S.E. Statistical analysis was performed using a two-way ANOVA followed by a post hoc comparison with Bonferroni correction. * denotes p < 0.05 time effect, and # denotes p < 0.05 genotype effect (n = 6 for myocardial triglyceride, n = 3–4 for Oil red O staining, n = 6–7 for net triglyceride synthesis, and n = 2–4 for lipolysis and triglyceride synthesis measurements).
FIGURE 4.
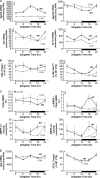
Diurnal variations in myocardial enzymes involved in triglyceride metabolism were attenuated in CCM hearts at both the mRNA (A) and protein (B and C) levels. Gene expression analyses of dgat2 (A), agpat3 (A), hsl (A), s3-12 (A), and atgl (D) were performed using quantitative RT-PCR in WT and CCM hearts isolated at ZT 0, 6, 12, and 18. Protein and phosphoprotein expression levels (B, C, and D) of triglyceride metabolism enzymes were determined by Western blot analysis. AMPK-α1 and AMPK-α2 activities (C) were also measured. Data are represented as the mean ± S.E. Statistical analysis was performed using a two-way ANOVA followed by a post hoc comparison with Bonferroni correction. * denotes p < 0.05 time effect, and # denotes p < 0.05 genotype effect (n = 6 for gene expression and n = 4–6 for protein, phosphoprotein, and activity measurements).
FIGURE 5.
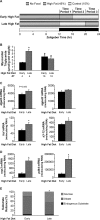
Consumption of a high fat diet at the end of the active/awake phase results in marked elevations in myocardial triglyceride (B), metabolic gene expression (C), myocardial fatty acid gene expression (D), and alterations in myocardial substrate reliance (E). After 16 weeks of diet intervention, myocardial triglyceride levels (B) were measured in hearts isolated at ZT4 and ZT16. Gene expression analyses of dgat2 (C), agpat3 (C), hsl (C), s3-12 (C), ucp3 (D), and pdk4 (D) were performed using quantitative RT-PCR in WT hearts isolated at ZT4. Substrate reliance (E) was measured in hearts perfused ex vivo in the working mode under basal conditions at ZT4. In this study hearts were perfused only with Krebs-Henseleit buffer containing 8 m
m
glucose, 0.4 m
m
oleate conjugated to 3% bovine serum albumin, and tracer amounts of [U-14C]glucose (0.12 mCi/liter) and [9,10-3H]oleate (0.067 mCi/liter) for glucose and oleate oxidation measurements, respectively. Data are represented as the mean ± S.E. Statistical analysis was performed using a two-way ANOVA. * denotes p < 0.05 diet effect; # denotes p < 0.05 time effect within a feeding group (n = 5–6 for gene expression, n = 6 for myocardial triglyceride, and n = 6–7 for ex vivo measurements).
FIGURE 6.
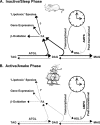
Proposed regulation of triglyceride metabolism by peripheral circadian clocks during the mouse sleep (A) and active/awake (B) phase. The cardiomyocyte circadian clock regulates HSL activity through transcriptional and post-translational mechanisms, likely an AMPK-dependent process. AMPK, AMP-activated protein kinase; DAG, diacylglycerol; MAG, monoacylglycerol; TAG, triacylglycerol.
Similar articles
- Biotinylation: a novel posttranslational modification linking cell autonomous circadian clocks with metabolism.
He L, Hamm JA, Reddy A, Sams D, Peliciari-Garcia RA, McGinnis GR, Bailey SM, Chow CW, Rowe GC, Chatham JC, Young ME. He L, et al. Am J Physiol Heart Circ Physiol. 2016 Jun 1;310(11):H1520-32. doi: 10.1152/ajpheart.00959.2015. Epub 2016 Apr 15. Am J Physiol Heart Circ Physiol. 2016. PMID: 27084392 Free PMC article. - Regulation of myocardial metabolism by the cardiomyocyte circadian clock.
Chatham JC, Young ME. Chatham JC, et al. J Mol Cell Cardiol. 2013 Feb;55:139-46. doi: 10.1016/j.yjmcc.2012.06.016. Epub 2012 Jul 2. J Mol Cell Cardiol. 2013. PMID: 22766272 Free PMC article. Review. - Disruption of the circadian clock within the cardiomyocyte influences myocardial contractile function, metabolism, and gene expression.
Bray MS, Shaw CA, Moore MW, Garcia RA, Zanquetta MM, Durgan DJ, Jeong WJ, Tsai JY, Bugger H, Zhang D, Rohrwasser A, Rennison JH, Dyck JR, Litwin SE, Hardin PE, Chow CW, Chandler MP, Abel ED, Young ME. Bray MS, et al. Am J Physiol Heart Circ Physiol. 2008 Feb;294(2):H1036-47. doi: 10.1152/ajpheart.01291.2007. Epub 2007 Dec 21. Am J Physiol Heart Circ Physiol. 2008. PMID: 18156197 - Altered myocardial metabolic adaptation to increased fatty acid availability in cardiomyocyte-specific CLOCK mutant mice.
Peliciari-Garcia RA, Goel M, Aristorenas JA, Shah K, He L, Yang Q, Shalev A, Bailey SM, Prabhu SD, Chatham JC, Gamble KL, Young ME. Peliciari-Garcia RA, et al. Biochim Biophys Acta. 2016 Oct;1861(10):1579-95. doi: 10.1016/j.bbalip.2015.12.012. Epub 2015 Dec 22. Biochim Biophys Acta. 2016. PMID: 26721420 Free PMC article. - Temporal partitioning of cardiac metabolism by the cardiomyocyte circadian clock.
Young ME. Young ME. Exp Physiol. 2016 Aug 1;101(8):1035-9. doi: 10.1113/EP085779. Exp Physiol. 2016. PMID: 27474266 Free PMC article. Review.
Cited by
- Biotinylation: a novel posttranslational modification linking cell autonomous circadian clocks with metabolism.
He L, Hamm JA, Reddy A, Sams D, Peliciari-Garcia RA, McGinnis GR, Bailey SM, Chow CW, Rowe GC, Chatham JC, Young ME. He L, et al. Am J Physiol Heart Circ Physiol. 2016 Jun 1;310(11):H1520-32. doi: 10.1152/ajpheart.00959.2015. Epub 2016 Apr 15. Am J Physiol Heart Circ Physiol. 2016. PMID: 27084392 Free PMC article. - Nuclear receptors linking circadian rhythms and cardiometabolic control.
Duez H, Staels B. Duez H, et al. Arterioscler Thromb Vasc Biol. 2010 Aug;30(8):1529-34. doi: 10.1161/ATVBAHA.110.209098. Arterioscler Thromb Vasc Biol. 2010. PMID: 20631353 Free PMC article. Review. - Novel Roles for the Transcriptional Repressor E4BP4 in Both Cardiac Physiology and Pathophysiology.
Mia S, Sonkar R, Williams L, Latimer MN, Rawnsley DR, Rana S, He J, Dierickx P, Kim T, Xie M, Habegger KM, Kubo M, Zhou L, Thomsen MB, Prabhu SD, Frank SJ, Brookes PS, Lazar MA, Diwan A, Young ME. Mia S, et al. JACC Basic Transl Sci. 2023 Jun 14;8(9):1141-1156. doi: 10.1016/j.jacbts.2023.03.016. eCollection 2023 Sep. JACC Basic Transl Sci. 2023. PMID: 37791313 Free PMC article. - Circadian Influences on Myocardial Ischemia-Reperfusion Injury and Heart Failure.
Eckle T, Bertazzo J, Khatua TN, Fatemi Tabatabaei SR, Moori Bakhtiari N, Walker LA, Martino TA. Eckle T, et al. Circ Res. 2024 Mar 15;134(6):675-694. doi: 10.1161/CIRCRESAHA.123.323522. Epub 2024 Mar 14. Circ Res. 2024. PMID: 38484024 Review. - Regulation of myocardial metabolism by the cardiomyocyte circadian clock.
Chatham JC, Young ME. Chatham JC, et al. J Mol Cell Cardiol. 2013 Feb;55:139-46. doi: 10.1016/j.yjmcc.2012.06.016. Epub 2012 Jul 2. J Mol Cell Cardiol. 2013. PMID: 22766272 Free PMC article. Review.
References
- Bray M. S., Shaw C. A., Moore M. W., Garcia R. A., Zanquetta M. M., Durgan D. J., Jeong W. J., Tsai J. Y., Bugger H., Zhang D., Rohrwasser A., Rennison J. H., Dyck J. R., Litwin S. E., Hardin P. E., Chow C. W., Chandler M. P., Abel E. D., Young M. E. (2008) Am. J. Physiol. Heart Circ. Physiol. 294, H1036–H1047 - PubMed
- Durgan D. J., Moore M. W., Ha N. P., Egbejimi O., Fields A., Mbawuike U., Egbejimi A., Shaw C. A., Bray M. S., Nannegari V., Hickson-Bick D. L., Heird W. C., Dyck J. R., Chandler M. P., Young M. E. (2007) Am. J. Physiol. Heart Circ. Physiol. 293, H2385–H2393 - PubMed
- Martino T., Arab S., Straume M., Belsham D. D., Tata N., Cai F., Liu P., Trivieri M., Ralph M., Sole M. J. (2004) J. Mol. Med. 82, 256–264 - PubMed
- van den Buuse M. (1999) Physiol. Behav. 68, 9–15 - PubMed
Publication types
MeSH terms
Substances
LinkOut - more resources
Full Text Sources
Molecular Biology Databases
