Telomere dynamics in human cells reprogrammed to pluripotency - PubMed (original) (raw)
Telomere dynamics in human cells reprogrammed to pluripotency
Steven T Suhr et al. PLoS One. 2009.
Erratum in
- PLoS One. 2010;5(3) doi: 10.1371/annotation/c786d141-fd0f-45fd-80ec-96d80be620dc
Abstract
Background: Human induced pluripotent stem cells (IPSCs) have enormous potential in the development of cellular models of human disease and represent a potential source of autologous cells and tissues for therapeutic use. A question remains as to the biological age of IPSCs, in particular when isolated from older subjects. Studies of cloned animals indicate that somatic cells reprogrammed to pluripotency variably display telomere elongation, a common indicator of cell "rejuvenation."
Methodology/principal findings: We examined telomere lengths in human skin fibroblasts isolated from younger and older subjects, fibroblasts converted to IPSCs, and IPSCs redifferentiated through teratoma formation and explant culture. In IPSCs analyzed at passage five (P5), telomeres were significantly elongated in 6/7 lines by >40% and approximated telomere lengths in human embryonic stem cells (hESCs). In cell lines derived from three IPSC-teratoma explants cultured to P5, two displayed telomeres shortened to lengths similar to input fibroblasts while the third line retained elongated telomeres.
Conclusions/significance: While these results reveal some heterogeneity in the reprogramming process with respect to telomere length, human somatic cells reprogrammed to pluripotency generally displayed elongated telomeres that suggest that they will not age prematurely when isolated from subjects of essentially any age.
Conflict of interest statement
Competing Interests: The authors have declared that no competing interests exist.
Figures
Figure 1. Lentiviral vectors used in IPSC production.
LTR: viral LTRS, EF1A-IN: elongation factor 1-alpha promoter, PGK: PGK promoter, M: cMyc, O: Oct4, S: Sox2, K: KLF4, L: Lin28, N: Nanog transgenes. 2A: translation interruption element, IRES: internal ribosomal entry site, Puro: puromycin resistance gene.
Figure 2. Phase-contrast images of FIB and IPSC lines used in this report (as labeled).
FIBA and FIBB displayed a flat stellate cytoplasm with irregular edges characteristic of fibroblast cell types (200X). IPSC lines displayed round colonies with regular edges evident in low magnification 40X images that were composed of tightly packed cells with prominent nucleoli (200X, lower panels of IPSC lines) that appeared morphologically homogenous within the center of the colony and flattened toward the edges where they were bounded by the MEF feeder layer. IPSCB1 and IPSB2 are shown only at 40X magnification.
Figure 3. Indicators of cell phenotype and pluripotency in IPSC lines.
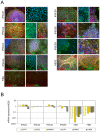
(A) Immunofluorescent analysis of pluripotency markers as labeled. Label color corresponds to marker color in images. Blue staining in all panels is DAPI labeling of nuclei. All IPSC lines displayed strong positive expression of pluripotency markers that were not observed at high levels in input FIB cells with the exception of the Lin28 antibody that reproducibly produced faint fluorescence in the cytoplasm of fibroblasts. (B) Representative QPCR analysis of FIB lines and reprogrammed IPSCs for markers of pluripotency and reprogramming factors relative to factor levels in hESCs. Input fibroblasts express very low levels of most factors whereas IPSCs display levels very similar to hESCs.
Figure 4. Indicators of pluripotency and differentiation in IPSC lines.
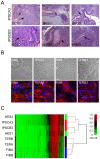
(A) Representative sections from teratomas generated from IPSC lines as labeled. Arrows in ectodermal (ECTO) tissue indicate neural rosettes, in mesodermal tissue (MESO) indicate cartilage, and in endodermal tissue (ENDO) indicate glandular columnar epithelium. mag. 100X. (B) Morphology of FIB lines and TER lines, as labeled, in phase-contrast images (top row) and stained for fibronectin (red, bottom row). mag. 400X. Blue is DNA stain. (C) Genome-wide methylation heat map and cluster analysis of representative input fibroblasts, IPSCs, TER, and hESC lines indicating that the overall pattern of methylation of IPSCs closely matches HES lines while differentiated TER lines cluster with input fibroblasts. Value indicates the level of methylation ranked from 0 (hypomethylated) to 1 (hypermethylated).
Figure 5. Analysis of telomeres in input, pluripotent, and re-differentiated cell lines.
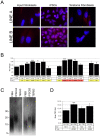
(A) Blue-stained nuclear DNA with punctate red fluorescence indicating telomeres hybridized to the PNA FISH telomere probe for input fibroblasts, IPSCs, or TER cells from lines A and B as labeled. mag. 400X. (B) Quantification of TRFs from cell lines as labeled. Yellow shading indicates significance compared to line FIBA and red shading significance compared to line FIBB. TRF indicates mean length in kilobase pairs (Kb). * = P<0.05, ** = P<0.01, *** = P<.001. Error bars indicate SEM. (C) Example of changes in TRF size in cell lines as labeled. Numbers at left are fragment lengths in kilobases. (D) Mean TRF lengths for all cell lines combined by type. Labeling as in part B. Significance calculated relative to FIB.
Similar articles
- Molecular insights into the heterogeneity of telomere reprogramming in induced pluripotent stem cells.
Wang F, Yin Y, Ye X, Liu K, Zhu H, Wang L, Chiourea M, Okuka M, Ji G, Dan J, Zuo B, Li M, Zhang Q, Liu N, Chen L, Pan X, Gagos S, Keefe DL, Liu L. Wang F, et al. Cell Res. 2012 Apr;22(4):757-68. doi: 10.1038/cr.2011.201. Epub 2011 Dec 20. Cell Res. 2012. PMID: 22184006 Free PMC article. - Association of telomere length with authentic pluripotency of ES/iPS cells.
Huang J, Wang F, Okuka M, Liu N, Ji G, Ye X, Zuo B, Li M, Liang P, Ge WW, Tsibris JC, Keefe DL, Liu L. Huang J, et al. Cell Res. 2011 May;21(5):779-92. doi: 10.1038/cr.2011.16. Epub 2011 Feb 1. Cell Res. 2011. PMID: 21283131 Free PMC article. - Derivation of induced pluripotent stem cells from orangutan skin fibroblasts.
Ramaswamy K, Yik WY, Wang XM, Oliphant EN, Lu W, Shibata D, Ryder OA, Hacia JG. Ramaswamy K, et al. BMC Res Notes. 2015 Oct 16;8:577. doi: 10.1186/s13104-015-1567-0. BMC Res Notes. 2015. PMID: 26475477 Free PMC article. - Linking Telomere Regulation to Stem Cell Pluripotency.
Liu L. Liu L. Trends Genet. 2017 Jan;33(1):16-33. doi: 10.1016/j.tig.2016.10.007. Epub 2016 Nov 23. Trends Genet. 2017. PMID: 27889084 Review. - Cancer cells as a new source of induced pluripotent stem cells.
Shamsian A, Sahebnasagh R, Norouzy A, Hussein SH, Ghahremani MH, Azizi Z. Shamsian A, et al. Stem Cell Res Ther. 2022 Sep 5;13(1):459. doi: 10.1186/s13287-022-03145-y. Stem Cell Res Ther. 2022. PMID: 36064437 Free PMC article. Review.
Cited by
- High resolution long-read telomere sequencing reveals dynamic mechanisms in aging and cancer.
Schmidt TT, Tyer C, Rughani P, Haggblom C, Jones JR, Dai X, Frazer KA, Gage FH, Juul S, Hickey S, Karlseder J. Schmidt TT, et al. Nat Commun. 2024 Jun 18;15(1):5149. doi: 10.1038/s41467-024-48917-7. Nat Commun. 2024. PMID: 38890299 Free PMC article. - Mechanisms, pathways and strategies for rejuvenation through epigenetic reprogramming.
Cipriano A, Moqri M, Maybury-Lewis SY, Rogers-Hammond R, de Jong TA, Parker A, Rasouli S, Schöler HR, Sinclair DA, Sebastiano V. Cipriano A, et al. Nat Aging. 2024 Jan;4(1):14-26. doi: 10.1038/s43587-023-00539-2. Epub 2023 Dec 15. Nat Aging. 2024. PMID: 38102454 Free PMC article. Review. - Reprogramming of adult human dermal fibroblasts to induced dorsal forebrain precursor cells maintains aging signatures.
McCaughey-Chapman A, Tarczyluk-Wells M, Combrinck C, Edwards N, Jones K, Connor B. McCaughey-Chapman A, et al. Front Cell Neurosci. 2023 Jan 30;17:1003188. doi: 10.3389/fncel.2023.1003188. eCollection 2023. Front Cell Neurosci. 2023. PMID: 36794263 Free PMC article. - Progress and challenges in directing the differentiation of human iPSCs into spinal motor neurons.
Castillo Bautista CM, Sterneckert J. Castillo Bautista CM, et al. Front Cell Dev Biol. 2023 Jan 5;10:1089970. doi: 10.3389/fcell.2022.1089970. eCollection 2022. Front Cell Dev Biol. 2023. PMID: 36684437 Free PMC article. Review. - Patient-Derived In Vitro Models of Microglial Function and Synaptic Engulfment in Schizophrenia.
Sheridan SD, Horng JE, Perlis RH. Sheridan SD, et al. Biol Psychiatry. 2022 Sep 15;92(6):470-479. doi: 10.1016/j.biopsych.2022.01.004. Epub 2022 Jan 19. Biol Psychiatry. 2022. PMID: 35232567 Free PMC article. Review.
References
- Blackburn EH. Telomeres and telomerase: their mechanisms of action and the effects of altering their functions. FEBS Lett. 2005;579:859–862. - PubMed
- Hug N, Lingner J. Telomere length homeostasis. Chromosoma. 2006;115:413–425. - PubMed
- Riethman H. Human telomere structure and biology. Annu Rev Genomics Hum Genet. 2008;9:1–19. - PubMed
- Harrington L. Does the reservoir for self-renewal stem from the ends? Oncogene. 2004;23:7283–7289. - PubMed
- Aubert G, Lansdorp PM. Telomeres and aging. Physiol Rev. 2008;88:557–579. - PubMed
Publication types
MeSH terms
LinkOut - more resources
Full Text Sources
Other Literature Sources
Miscellaneous


