Langerhans cell (LC) proliferation mediates neonatal development, homeostasis, and inflammation-associated expansion of the epidermal LC network - PubMed (original) (raw)
Langerhans cell (LC) proliferation mediates neonatal development, homeostasis, and inflammation-associated expansion of the epidermal LC network
Laurent Chorro et al. J Exp Med. 2009.
Abstract
Most tissues develop from stem cells and precursors that undergo differentiation as their proliferative potential decreases. Mature differentiated cells rarely proliferate and are replaced at the end of their life by new cells derived from precursors. Langerhans cells (LCs) of the epidermis, although of myeloid origin, were shown to renew in tissues independently from the bone marrow, suggesting the existence of a dermal or epidermal progenitor. We investigated the mechanisms involved in LC development and homeostasis. We observed that a single wave of LC precursors was recruited in the epidermis of mice around embryonic day 18 and acquired a dendritic morphology, major histocompatibility complex II, CD11c, and langerin expression immediately after birth. Langerin(+) cells then undergo a massive burst of proliferation between postnatal day 2 (P2) and P7, expanding their numbers by 10-20-fold. After the first week of life, we observed low-level proliferation of langerin(+) cells within the epidermis. However, in a mouse model of atopic dermatitis (AD), a keratinocyte signal triggered increased epidermal LC proliferation. Similar findings were observed in epidermis from human patients with AD. Therefore, proliferation of differentiated resident cells represents an alternative pathway for development in the newborn, homeostasis, and expansion in adults of selected myeloid cell populations such as LCs. This mechanism may be relevant in locations where leukocyte trafficking is limited.
Figures
Figure 1.
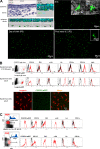
Early recruitment of a CX3CR1+ CD45+ CD115+ CD11b+ myeloid precursor in the epidermis between E14 and E18. (A, top left) H&E staining and three-dimensional reconstruction of skin from E14 CX3CR1-GFP Rag−/− γc−/− mice. CX3CR1+ cells are labeled in green and nuclei are labeled in blue. Confocal Z-stacks were acquired using a Leica SP5 microscope. Images show a 2–4-µm thick virtual section of the tissue. The dashed line indicates the separation between the dermis and epidermis. CX3CR1+ cells can be detected in the dermis but not in the epidermis. Results are representative of 10 skin samples per mouse (n = 4). (top right and bottom) Tiled micrographs of epidermal sheets of CX3CR1-GFP Rag−/− γc−/− E18 fetuses and pups at P0 (the day of birth) and P2. CX3CR1+ cells are labeled in green. Tiles were obtained by assembling a series of maximal intensity projections of Z-stacks. (insets) Enlarged CX3CR1+ cells (green) and nuclei (white). CX3CR1-expressing cells are first detected in the epidermis at E18, and acquire a dendritic shape between P0 and P2 (n = 3–4 mice for each time point). (B, top) Flow cytometry analysis of epidermal cells from E18 CX3CR1-GFP Rag−/− γc−/− embryos and 10-wk-old langerin-GFP mice. Cells were labeled with antibodies against CSF-1R (CD115), Flt3 (CD135), c-kit (CD117), I-A, CD11c, CD11b, and Lyc6 and analyzed by multicolor flow cytometry. Dot plots show the gate used for analysis of GFP-expressing LC precursors and adult LCs. Overlaid histograms show the expression of surface markers on gated GFP+ cells (red line) and control (fluorescence minus one; black line). Results are representative of three to five experiments with similar results. (bottom) Micrographs display maximal intensity projections of Z-stacks from epidermal sheets of 10-wk-old CX3CR1-GFP Rag−/− γc−/− mice. CX3CR1-expressing cells are labeled in green and langerin is labeled in red. Results are representative of 12 0.03-mm2 Z-stacks per mouse (n = 4). Adult LCs do not express CX3CR1 (GFP). (C) Flow cytometry analysis of bone marrow MDPs and CDPs. Bone marrow cells from adult CX3CR1-GFP Rag2−/− γc−/− mice were labeled with antibodies against lineage markers (CD11b, NK1.1, CD3, Ter119, and CD19), c-kit (CD117), Flt3 (CD135), CSF-1R (CD115), CD11c, and I-A and analyzed by multicolor flow cytometry. MDPs are defined as CX3CR1high (GFP) c-kit+ lineage−, whereas CDPs are defined as lineage− c-kitlow Flt3+. Overlaid histograms show expression of surface markers on gated MDPs and CDPs (red line) over control (black line). Results are representative of three to five experiments with similar results. SSC, side scatter.
Figure 2.
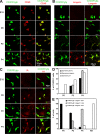
Epidermal CX3CR1+ CD45+ myeloid precursors differentiate into langerin+ MHCII+ LCs between E18 and P2. Expression of (A) CD45, (B) langerin, and (C) MHCII. Maximal intensity projections of Z-stacks from epidermal sheets of CX3CR1-GFP Rag−/− γc−/− mice at E18, P0, P2, and P4 are displayed. CX3CR1-expressing cells are labeled in green and CD45, langerin, and MHCII are labeled in red using antibodies. Results are representative of 20 0.01-mm2 Z-stacks per time point and per mouse (n = 3 mice per experimental time point). (D) Bar graph showing the percentage of epidermal CX3CR1-GFP+ cells expressing CD11c, langerin, or MCHII (I-A) at P0, P2, and P4. For each mouse, a range of 200–800 cells was analyzed. Means ± SD are displayed (n = 1–3 mice per experimental point). (E) Bar graph shows the percentage of epidermal cells expressing CX3CR1 but not langerin, both CX3CR1 and langerin, or langerin only at P0, P2, P4, and 8 wk. For each mouse, a range of 300–1,000 cells was analyzed. Means ± SD are displayed (n = 3–4 mice per experimental point).
Figure 3.
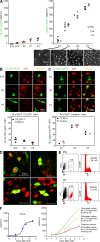
LCs expand in the epidermis by proliferating during the first week of life to establish an LC network. (A, left) Kinetic of the number of CX3CR1+ cells per square millimeter of epidermis of CX3CR1-GFP Rag−/− γc−/− mice at various ages (E14, E18, P0, P1, and P2). CX3CR1+ cells appear slowly in the epidermis between E18 and P2. Cells were enumerated as indicated in Materials and methods. Each dot represents an individual mouse. (right) Kinetic of the number of langerin-GFP+ cells per square millimeter of the epidermis of langerin-GFP CCR2+/− or langerin-GFP CCR2−/− mice at various ages (P2, P4, P5, and P7). The epidermis was studied by intravital microscopy in live animals, as indicated in Materials and methods. LCs rapidly expand between P2 and P7. Each dot represents an individual mouse. Representative micrographs of maximal intensity projections of Z-stacks obtained at various time points are displayed below the graph. (B, top) Micrographs of epidermal sheets of CX3CR1-GFP Rag−/− γc−/− mice at various ages (E18, P0, and P2). CX3CR1+ cells are labeled in green and Ki67 is labeled in red. Images are optical slices from Z-stacks (optical zoom factor 2). (bottom) The graph shows the percentage of CX3CR1+ cells expressing the nuclear proliferation marker Ki67 at various ages. For each mouse, a range of 100–500 cells was analyzed. Each dot represents an individual mouse. (C) Same as in B. Langerin-GFP CCR2+/− or langerin-GFP CCR2−/− mice at various ages (P2, P4, and P7) were analyzed. Horizontal lines represent means. (D) LC mitosis within the epidermis. Micrographs of langerin-GFP+ cells (green) expressing Ki67 (red) from epidermal sheets of P4 langerin-GFP mice. Pictures are optical slices from Z-stacks (optical zoom factor 2). Results are representative of six mice. For more information, see
Fig. S3
and
Video 1
. (E) Cell-cycle analysis by PI staining of sorted P4 and P7 LCs by flow cytometry. Dot plots show the gate used for GFP-expressing LC sorting. Percentages of GFP+ cells among all events are indicated. Histograms show the cell-cycle analysis. Percentages of gated singlet PI+ events in the S/G2/M phase are indicated. Means of three and two independent experiments ± SD at P4 and P7, respectively, are indicated. (F) Estimate of the duration of the langerin+ cell-cycle during the first week of life. Using a nonlinear regression model (sigmoidal curve) based on data from A (R-squared value of the trend line = 0.98) and cell-cycle data from E, we formulated a polynomial regression model to extrapolate the percentage of cells proliferating at each day after birth (0–7 d), and we calculated the total number of cells per square millimeter over time that would be obtained considering one (red line), two (yellow line), or three (green line) divisions per day per dividing cell. Experimental data are represented by blue diamonds. The graph shows that experimental data fit with a model of in situ proliferation of LCs in which the length of the cell cycle is between 12 and 24 h. SSC, side scatter.
Figure 4.
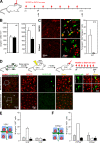
Proliferation of resident epidermal LCs in the steady state. (A) Tiled micrograph of ear epidermal sheets of a 8-wk-old langerin-GFP mouse. LCs are labeled in green and Ki67 is labeled in red. This tile has been obtained by assembling a series of maximal intensity projection Z-stacks. Ki67-expressing LCs are indicated with white circles. (inset) A three-dimensional reconstruction of a Ki67+ LC as in D (for more information see
Video 2
). Results are representative of epidermal sheets from four mice. (B, left) The percentage of Ki67+ langerin-GFP+ cells at various ages (W4, 4 wk; W8, 8 wk; W14, 14 wk). For each animal, 160–400 cells were analyzed. Means ± SD are displayed (n = 4 mice per experiment). (right) The number of langerin+ cells per square millimeter in the ear epidermis of littermate 4-wk-old CCR2+/+ and CCR2−/− mice. Means of three experiments ± SD are displayed. (C) Graph shows the distance in micrometers between LCs and their closest neighbor. More than 600 langerin-GFP+ cells and >60 Ki67+ langerin-GFP+ cells were analyzed from the epidermis of 8-wk-old langerin-GFP+ mice. Similar results were obtained from the epidermis of 4- and 14-wk-old mice (n = 4). (D) Snapshots of a three-dimensional reconstruction of Z-stacks of 8-wk-old Ki67-expressing epidermal langerin-GFP+ cells using Imaris software. Results are representative of epidermal sheets from four mice. For more information, see
Video 3
and
Video 4
. (E) Cell-cycle analysis by flow cytometry of sorted LCs as in Fig. 3 E. Percentages of gated singlet PI+ events in the S/G2/M phase are indicated. The experiments have been repeated three times with similar results. (F, top) CD45.1+ C57BL/6 recipient mice were irradiated (10 Gy) and injected with107 bone marrow cells obtained from adult langerin-GFP CD45.2+ mice to allow identification of donor-derived cells. 5 wk after transplantation, hematopoietic engraftment was analyzed by measurement of blood chimerism, and ears were collected 7 wk after transplantation. (bottom) Micrographs of epidermal sheets of control langerin-GFP mice and of irradiated chimeric mice. Langerin-GFP+ cells are labeled in green (anti-eGFP antibody) and langerin+ cells are labeled in red (antilangerin antibody). Maximal intensity projections from Z-stacks are displayed. Results are representative of epidermal sheets from four mice. HF, hair follicle; SSC, side scatter.
Figure 5.
A keratinocyte-derived signal can drive a massive proliferation of LCs during skin inflammation. (A) Time course of treatment of the ears of mice with MC903 or ethanol. Analysis of the epidermis was performed at days 4 and 14. (B) Graphs show the number of langerin+ cells per square millimeter in the epidermis of wild-type mice treated with MC903 (white) or ethanol (black). Means ± SD are displayed (n = 3). (C) Micrographs are representative maximal intensity projections (left) or optical slices (right) of Z-stacks from epidermal sheets of mice treated for 14 d. Langerin+ cells are either labeled in red (left) or in green (right), and Ki67 is labeled in red (right). Results are representative of epidermal sheets from two to three animals. The graph shows the percentage of langerin+ cells expressing Ki67 after 14 d of MC903 (white) or ethanol (black) treatment. For each animal, 150–300 langerin+ cells were analyzed. Means of two to three experiments ± SD are displayed. (D) Similar to the experiment described in Fig. 4 F. 7 wk after transplantation, MC903 or ethanol was applied on the ear every other day for 14 d. Micrographs show epidermal sheets from MC903-treated ears (top) or epidermal sheets from control ethanol-treated ears (bottom). (left) Langerin-GFP+ cells are labeled in green (anti-eGFP antibody) and langerin+ cells are labeled in red (antilangerin antibody). Maximal intensity projections from Z-stacks are shown. Results are representative of 10 0.56-mm2 Z-stacks per mice. The pictures show few (<1%) bone marrow–derived LCs recruited in the epidermis of MC903-treated mice after 2 wk of treatment. (right) Langerin-GFP+ cells (green) are not labeled with Ki67 (red). The pictures show two representative examples of langerin-GFP+ cells recruited in the epidermis after MC903 treatment. For each animal, >500 Ki67+ cells were analyzed. (E) Treatment of VDR−/− mice with MC903 or ethanol. Mice were treated with MC903 or ethanol as in A, and analysis of the epidermis was performed at day 14. The bar graph represents the percentage of langerin+ cells expressing Ki67 in VDR+/+ or VDR−/− mice either untreated (gray bar) or treated for 14 d with MC903 (white bar) or ethanol (black bar). For each animal, 250–600 langerin+ cells were analyzed. Means of two experiments ± SD are displayed. (F) Similar to the experiment described in E but performed on VDRep+/+ and VDRep−/− mice. HF, hair follicle.
Figure 6.
Proliferation of human LCs in the epidermis from healthy controls and AD patients. Epidermal sheets were obtained from four healthy donors and two AD patients and analyzed by confocal microscopy for expression of langerin (green) and Ki67 (red). (A) Representative maximal intensity projections of Z-stacks of healthy epidermis. Ki67+/langerin+ LCs are circled in white, and nuclear localization of Ki67 was confirmed by three-dimensional visualization (for more information see
Video 5
). (B) Ki67+ LC doublets were detected in human epidermis. (C) A significantly higher percentage of Ki67+ LCs was observed in AD epidermis compared with healthy controls (14.5 ± 1.55% and 3.21 ± 0.33%, respectively; P = 0.003 ; n = 2 and 4, respectively). A minimum of 500 LCs, as visualized by langerin expression, were analyzed per healthy donor and patient. Results are expressed as mean percentages of Ki67+LCs ± SD. (D) Representative maximal intensity projections of Z-stacks of epidermis from AD patients. A group of three Ki67+ LCs is shown as a three-dimensional reconstruction. Ki67+/langerin+ LCs are circled in white. The scale is graduated in micrometers.
Figure 7.
Comparison of the classical model of myeloid cell homeostasis and LC homeostasis. (A) Classical model for cell proliferation and differentiation. Precursors are located in a niche (e.g., the bone marrow), self-renew, and give rise to proliferating committed progenitors and precursors. Precursors with a limited differentiation potential migrate to the peripheral tissue and complete their differentiation. During the life of the animal, when differentiated cells die, new precursors will migrate from the bone marrow to replace them. (B) LC precursors are recruited into the epidermis as a single wave before birth and differentiate in situ, and then proliferate to form a network. No further input from the progenitors is needed. During life, differentiated cells can enter the cell cycle when required.
Similar articles
- A model system using tape stripping for characterization of Langerhans cell-precursors in vivo.
Holzmann S, Tripp CH, Schmuth M, Janke K, Koch F, Saeland S, Stoitzner P, Romani N. Holzmann S, et al. J Invest Dermatol. 2004 May;122(5):1165-74. doi: 10.1111/j.0022-202X.2004.22520.x. J Invest Dermatol. 2004. PMID: 15140219 - Langerin-expressing dendritic cells in human tissues are related to CD1c+ dendritic cells and distinct from Langerhans cells and CD141high XCR1+ dendritic cells.
Bigley V, McGovern N, Milne P, Dickinson R, Pagan S, Cookson S, Haniffa M, Collin M. Bigley V, et al. J Leukoc Biol. 2015 Apr;97(4):627-34. doi: 10.1189/jlb.1HI0714-351R. Epub 2014 Dec 16. J Leukoc Biol. 2015. PMID: 25516751 Free PMC article. - The dermis contains langerin+ dendritic cells that develop and function independently of epidermal Langerhans cells.
Poulin LF, Henri S, de Bovis B, Devilard E, Kissenpfennig A, Malissen B. Poulin LF, et al. J Exp Med. 2007 Dec 24;204(13):3119-31. doi: 10.1084/jem.20071724. Epub 2007 Dec 17. J Exp Med. 2007. PMID: 18086861 Free PMC article. - Origin, homeostasis and function of Langerhans cells and other langerin-expressing dendritic cells.
Merad M, Ginhoux F, Collin M. Merad M, et al. Nat Rev Immunol. 2008 Dec;8(12):935-47. doi: 10.1038/nri2455. Nat Rev Immunol. 2008. PMID: 19029989 Review. - [Langerhans cells in the physiopathology of atopic dermatitis].
Bieber T, Bruijnzeel-Koomen C. Bieber T, et al. Ann Dermatol Venereol. 1990;117(3):185-93. Ann Dermatol Venereol. 1990. PMID: 2193589 Review. French.
Cited by
- Innate Immunity in Diabetic Wound Healing: Focus on the Mastermind Hidden in Chronic Inflammatory.
Geng K, Ma X, Jiang Z, Huang W, Gao C, Pu Y, Luo L, Xu Y, Xu Y. Geng K, et al. Front Pharmacol. 2021 Apr 21;12:653940. doi: 10.3389/fphar.2021.653940. eCollection 2021. Front Pharmacol. 2021. PMID: 33967796 Free PMC article. Review. - Human and Mouse Mononuclear Phagocyte Networks: A Tale of Two Species?
Reynolds G, Haniffa M. Reynolds G, et al. Front Immunol. 2015 Jun 25;6:330. doi: 10.3389/fimmu.2015.00330. eCollection 2015. Front Immunol. 2015. PMID: 26124761 Free PMC article. Review. - Transcriptional programming of the dendritic cell network.
Belz GT, Nutt SL. Belz GT, et al. Nat Rev Immunol. 2012 Jan 25;12(2):101-13. doi: 10.1038/nri3149. Nat Rev Immunol. 2012. PMID: 22273772 Review. - Langerhans cell homeostasis and activation is altered in hyperplastic human papillomavirus type 16 E7 expressing epidermis.
Abd Warif NM, Stoitzner P, Leggatt GR, Mattarollo SR, Frazer IH, Hibma MH. Abd Warif NM, et al. PLoS One. 2015 May 18;10(5):e0127155. doi: 10.1371/journal.pone.0127155. eCollection 2015. PLoS One. 2015. PMID: 25992642 Free PMC article. - A wave of monocytes is recruited to replenish the long-term Langerhans cell network after immune injury.
Ferrer IR, West HC, Henderson S, Ushakov DS, Santos E Sousa P, Strid J, Chakraverty R, Yates AJ, Bennett CL. Ferrer IR, et al. Sci Immunol. 2019 Aug 23;4(38):eaax8704. doi: 10.1126/sciimmunol.aax8704. Sci Immunol. 2019. PMID: 31444235 Free PMC article.
References
- Alberts B., Johnson A., Lewis J., Raff M., Roberts K., Walter P. 2002. Molecular Biology of the Cell. 4th edition Garland Science, New York: 1616 pp
- Auffray C., Fogg D.K., Narni-Mancinelli E., Senechal B., Trouillet C., Saederup N., Leemput J., Bigot K., Campisi L., Abitbol M., et al. 2009. CX3CR1+ CD115+ CD135+ common macrophage/DC precursors and the role of CX3CR1 in their response to inflammation. J. Exp. Med. 206:595–606 10.1084/jem.20081385 - DOI - PMC - PubMed
Publication types
MeSH terms
Substances
LinkOut - more resources
Full Text Sources
Other Literature Sources
Molecular Biology Databases
Research Materials


